DCM Reports and Dashboards
- Mikko Juola (Deactivated)
- Mikko Juola

This page lists and describes all reports included in the DCM application. Most of the reports are included in different dashboards.
These reports and dashboards are provided as examples. It's highly recommended to create your own dashboards by taking a copy and selecting the reports you would like to use. So, always make a copy of the original report first so that you don't lose any changes includes in the future DCM versions.
Current list is based on DCM version 5.1.1.
Dashboards
DCM includes several dashboards for different audiences and perspectives. More information about the dashboards included in different DCM versions can be found via the links below:
- DCM 5.1.1: Split the "Data Quality Overview" dashboard into Weekly and Monthly views
- DCM 5.1: Added more interactive filters
- DCM 5.0: First DCM version with interactive dashboards
Reports
The following reports are included in the DCM application. Please note that not all of these are included in a dashboard, but can be used via Reports View/Run list or by adding to your own dashboards.
NEW | Indicates that the report has been added in the last couple of releases. |
IN USE | Means that report is valid and can be used as described. Note that not all reports "In use" are included in default dashboards, but these are worth checking when creating new dashboards and especially before starting to create new reports based on DCM data. |
DEPRECATED | Means that the report is no longer relevant and will be deleted on a later release. These reports also have "(Deprecated)" text in their name. This indicates to DCM customers that these reports can be deleted eventually (when deleted from DCM app also) and should not be used anymore. |
DELETED | Means that system admin should delete that report from the customer instance. Deletions can not be included in scoped applications, so deletions have to be done manually. |
Active reports
Note: All thumbnails may not be up-to-date and this report list is still under construction.
Report Title (Name, if <> Title) | Thumbnail | Type | Source table | Description | Status | on Dashboard | |
|---|---|---|---|---|---|---|---|
| 1 | Active Task Configurations DCM Tasks - Active Task Configurations |
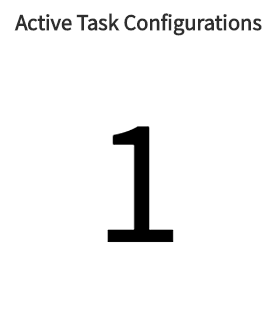
| Single score | x_jugr_dcm_task | Number of currently active task configurations that can create new DCM tasks while audits are being run. Usage: shows if automated task creation is in use and how widely it's used. Also provides access to active task configuration list. | IN USE | Workspace - Overview |
| 2 | Aging Data Remediation Tasks DCM Tasks - Aging Data Remediation Task |
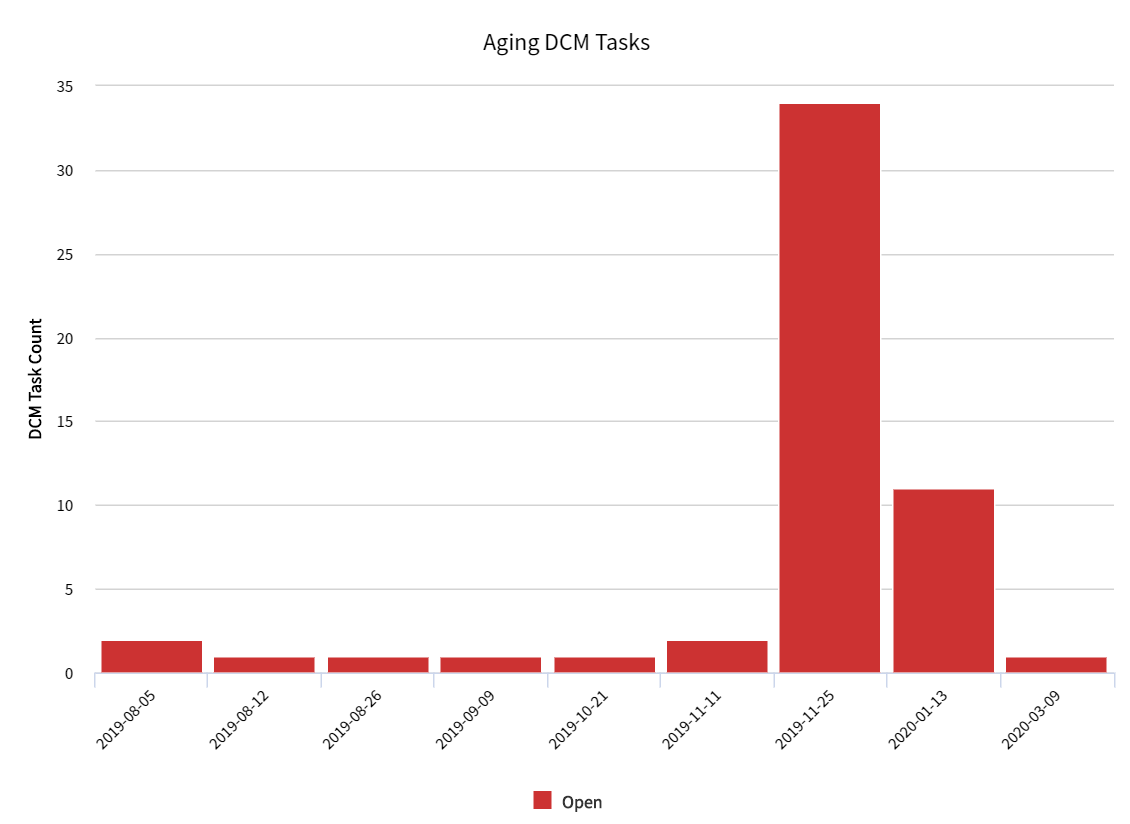
| Bar | x_jugr_dcm_task | Open data remediation tasks based on their creation date. Usage: Left side of the report shows how many new tasks are getting created while the right side shows if these tasks are getting completed or not. High bars on the right side means that the process does not work properly. | IN USE | Workspace - Overview |
| 3 | My Aging Data Remediation Tasks DCM Tasks - My Domains - Aging Data Remediation Task | Bar | x_jugr_dcm_task | Same as "Aging Data Remediation Tasks", but filtered based on Data Domains related to current user. | IN USE | Audit - My Data Domains | |
| 4 | DCM - Audited fields per Field Setup DCM - Audited fields per Field Setup |
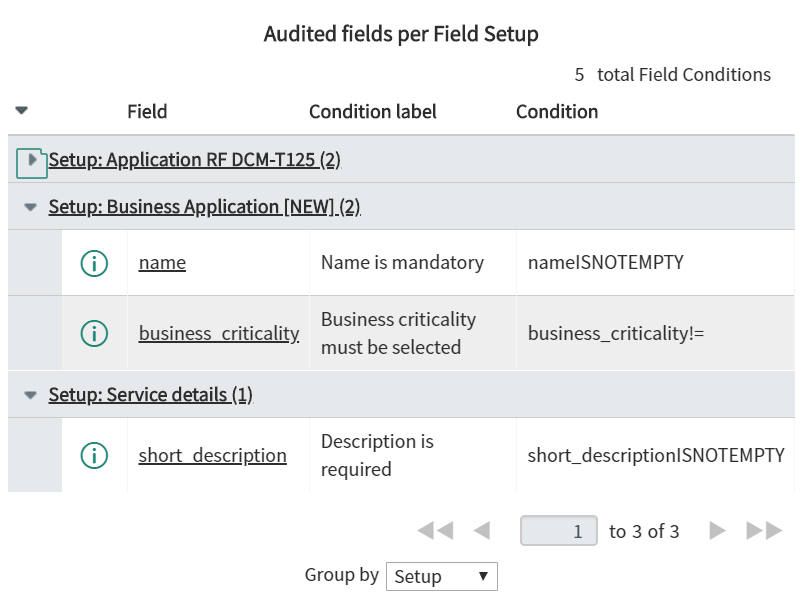
| List | x_jugr_dcm_... field_condition | List of field names and their conditions that are included in different Field setups. Usage: For documentation purposes. | IN USE | Blueprints - Overview |
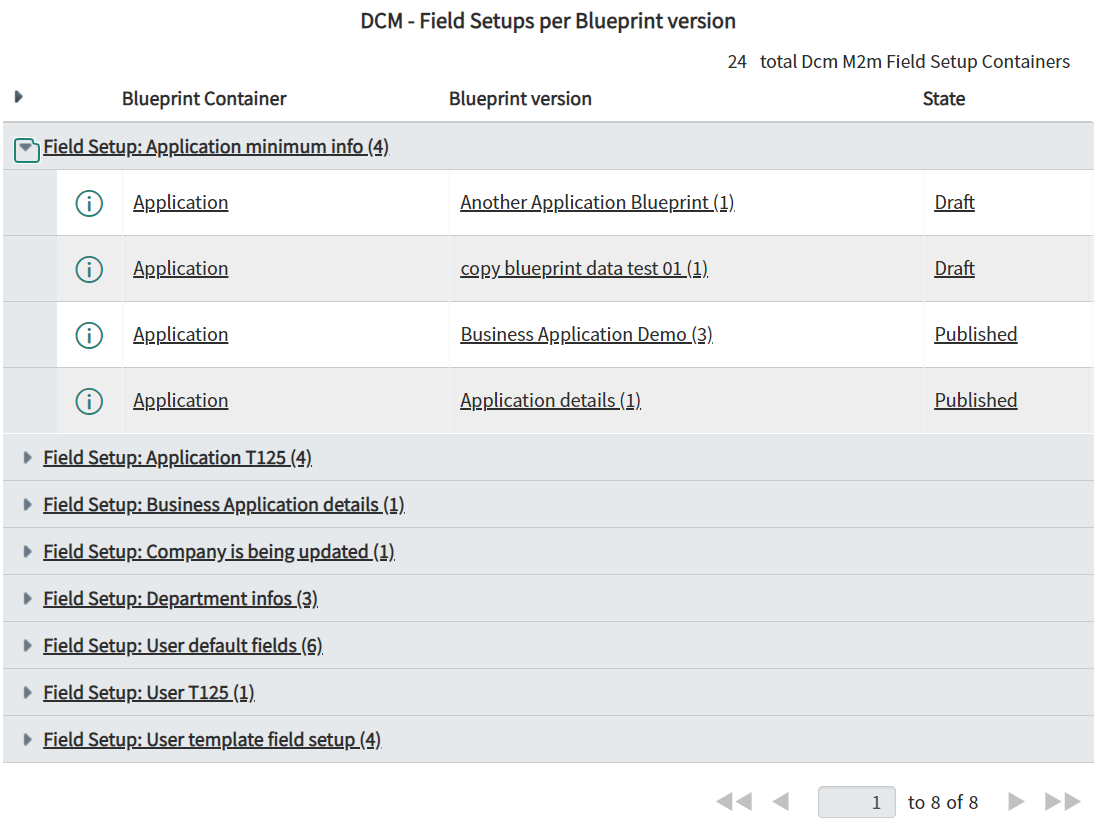
| 5 | DCM - Field Setups per Blueprint version DCM - Field Setups per Blueprint version |
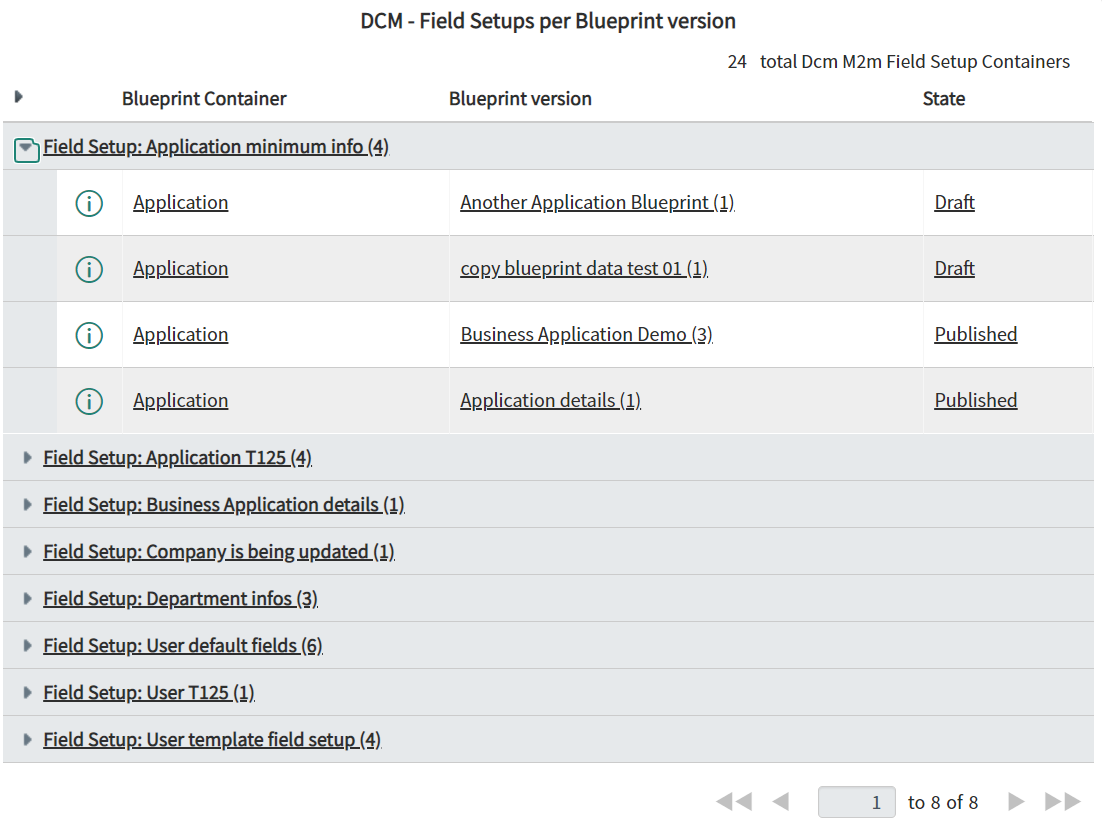
| List | x_jugr_dcm_m2m_... field_setup_container | Blueprint version list grouped by Field Setups used on those blueprints. Field Setups are common definitions and can be used by multiple blueprint versions. Usage: Identify how different Field Setups are used on different Blueprint versions. | IN USE | Blueprints - Overview |
| 6 | Bad data removed by Fixed DCM Tasks DCM Tasks - Bad data removed by Fixed DCM Tasks |
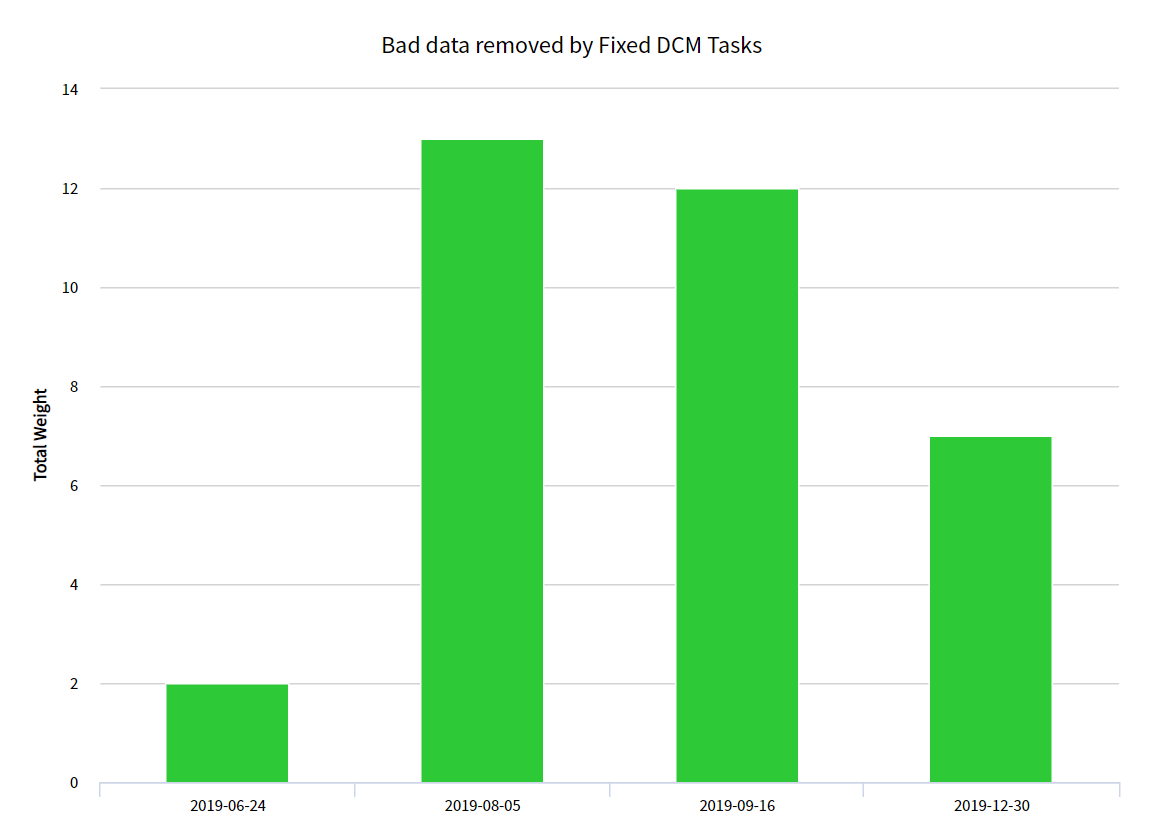
| Trend | x_jugr_dcm_task | Total weight on completed DCM Tasks as a weekly trend. | IN USE | NO |
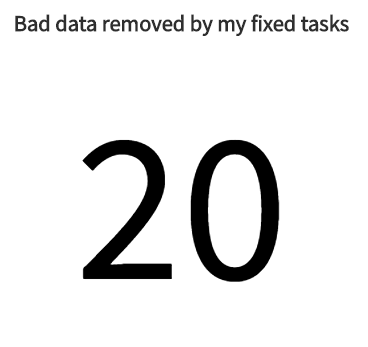
| 7 | Bad data removed by my fixed tasks DCM Tasks - Bad data removed by my fixed tasks |
| Single score | x_jugr_dcm_task | Total weight on all completed DCM tasks assigned to the current user. Usage: shows how much the current user has been able to fix issues based on completed DCM tasks. | IN USE | Workspace - My Tasks |
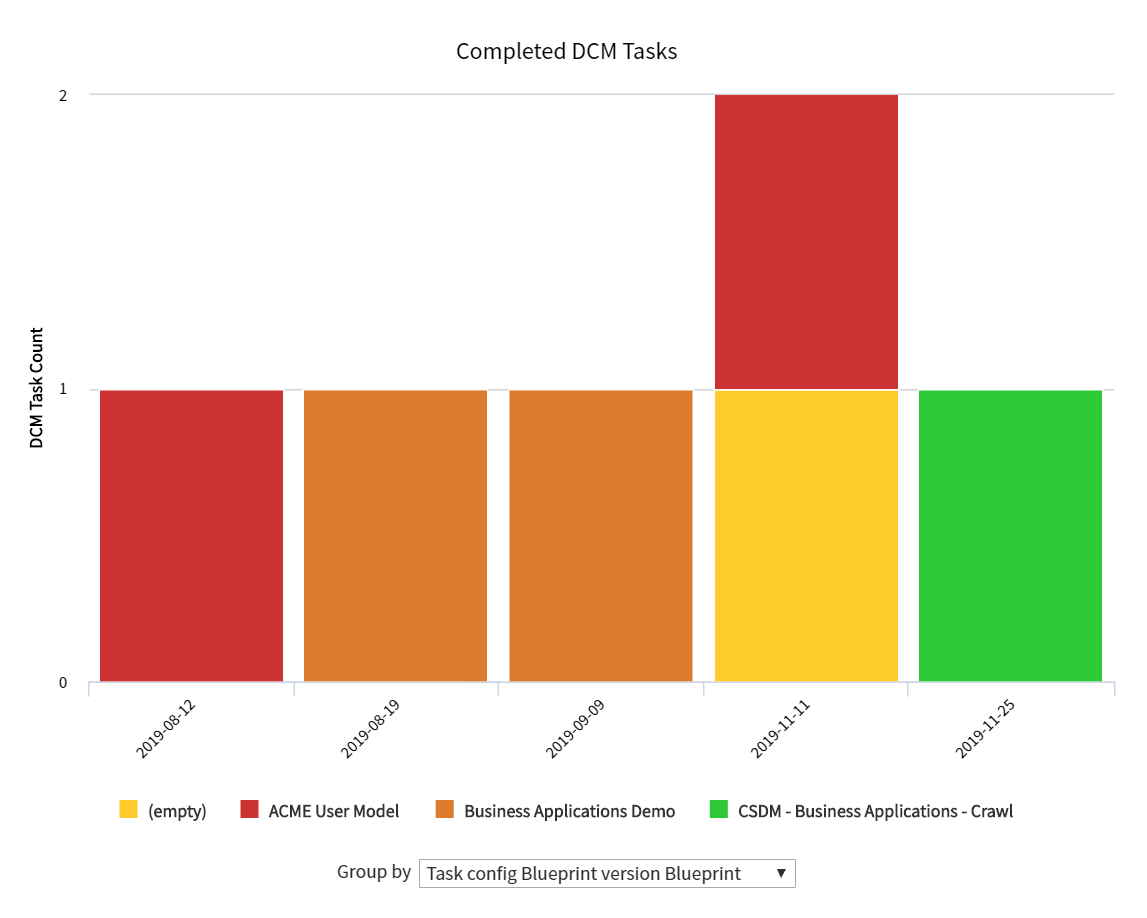
| 8 | Completed Data Remediation Tasks DCM Tasks - Completed Data Remediation Tasks |
| Trend | x_jugr_dcm_task | Number of DCM tasks completed as a weekly trend. Default grouping is by Data Domain. Usage: showing the remediation activities in different domains. | IN USE | Workspace - Overview |
| 9 | Data Tier Compliance (last 30 days) DCM - Data Tier Compliance (last 30 days) | Multilevel pivot | x_jugr_dcm_... audit_instance | Average data compliance per data domain and data tier for the last 30 days shown as a multilevel pivot table. Columns are showing the Implementation phase of the blueprint version. If audits are run once per week, this should show the current situation. If audits are running more often than once a week, then the report is showing avg compliance for the last 7 days. Usage: Shows the "current state" for data quality in different domains. | NEW New in R5.1.1 | Audit - Data Quality - Monthly Overview | |
| 10 | Data Tier Compliance (last 7 days) DCM - Data Tier Compliance (last 7 days) |
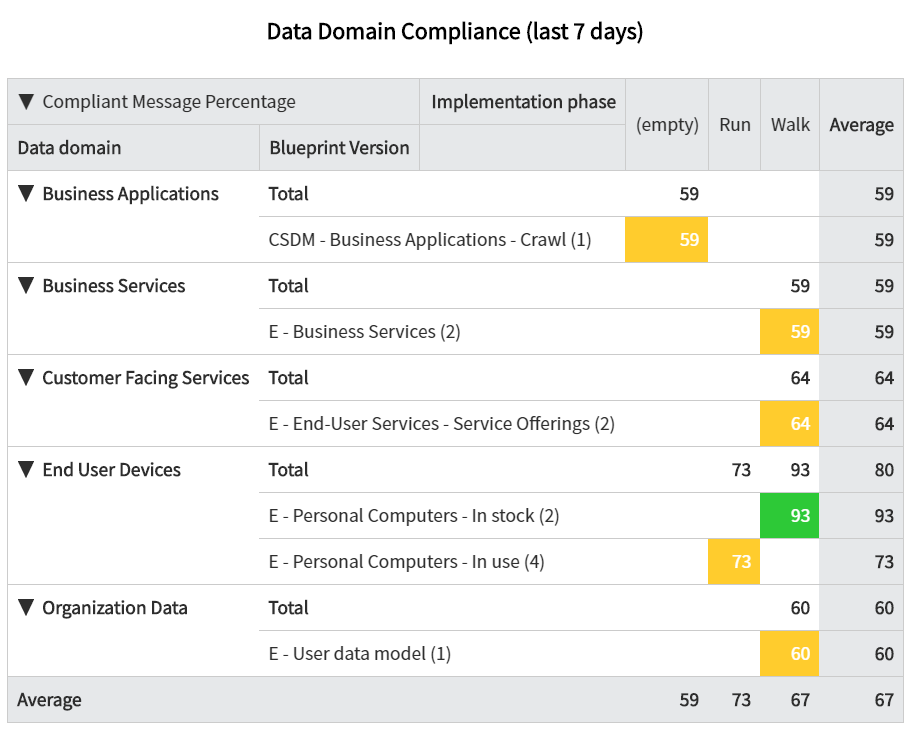
| Multilevel pivot | x_jugr_dcm_... audit_instance | Average data compliance per data domain and data tier for the last 7 days shown as a multilevel pivot table. Columns are showing the Implementation phase of the blueprint version. If audits are run once per week, this should show the current situation. If audits are running more often than once a week, then the report is showing avg compliance for the last 7 days. Usage: Shows the "current state" for data quality in different domains. | IN USE | Audit - Data Quality - Weekly Overview |
| 11 | My Data Domain Compliance (last 7 days) DCM - My Domains - Data Domain Compliance (last 7 days) | Multilevel pivot | x_jugr_dcm_... audit_instance | Same as "Data Domain Compliance (last 7 days)", but filtered based on Data Domains related to current user. Usage: See latest audit results and access the more detailed results by clicking a number an opening an Audit Instance into the Audit Results view. | IN USE | Audit - My Data Domains | |
| 12 | Audited records - Weekly trend DCM - Audited records per result type weekly trend |
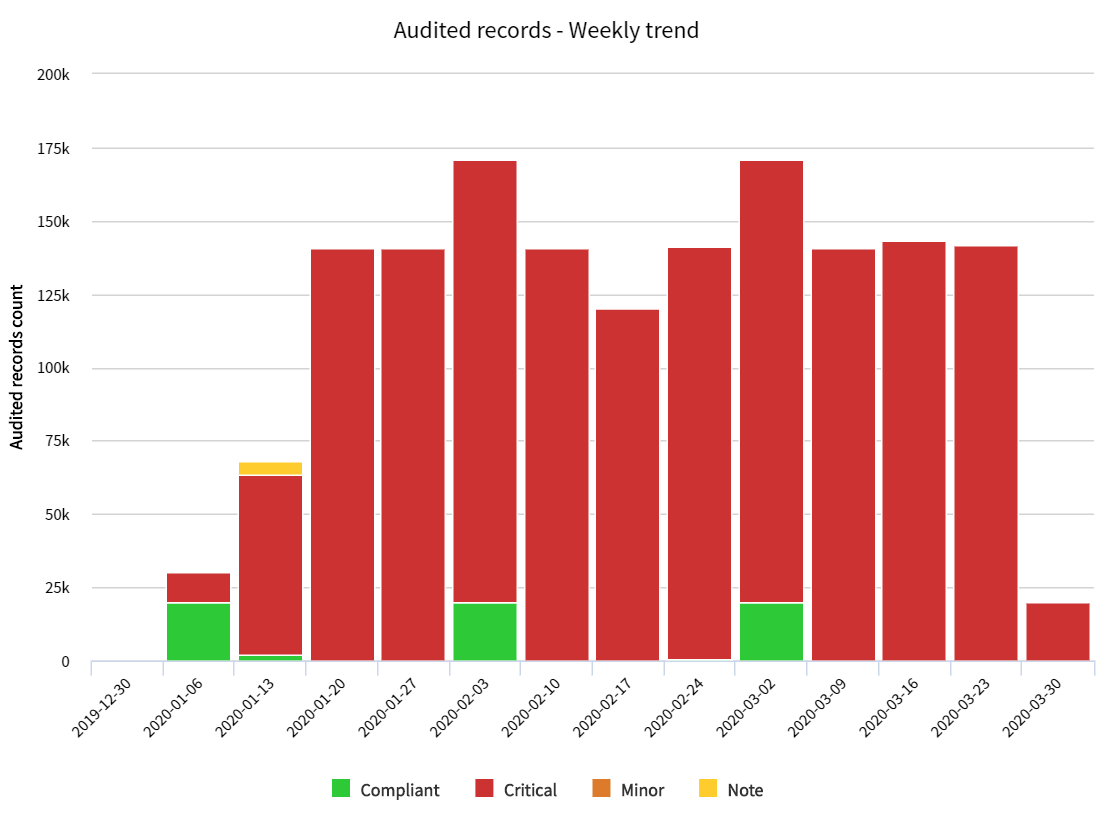
| Trend | x_jugr_dcm_... audit_instance_metric | Total number of audited records (root records) per week grouped by the audit result type. Audited record is only compliant when the record is 100% compliant with the blueprint. Usage: Compared to a blueprint compliance trend that is showing percentages, this one will show the "audit volumes" per week. | IN USE | Audit - Data Quality - Weekly Overview |
| 13 | Audited records - Monthly trend DCM - Audited records per result type monthly trend |
| Trend | x_jugr_dcm_... audit_instance_metric | Total number of audited records (root records) per month grouped by the audit result type. Audited record is only compliant when the record is 100% compliant with the blueprint. Usage: Compared to a blueprint compliance trend that is showing percentages, this one will show the "audit volumes" per month. | NEW New in R5.1.1 | Audit - Data Quality - Monthly Overview |
| 14 | My Domains Audited records - Weekly trend DCM - My Domains - Audited Records - Weekly trend |
| Trend | x_jugr_dcm_... audit_instance_metric | Same as "Audited record - Weekly trend" but filtered based on data domains related to current used. | IN USE | Audit - My Data Domains |
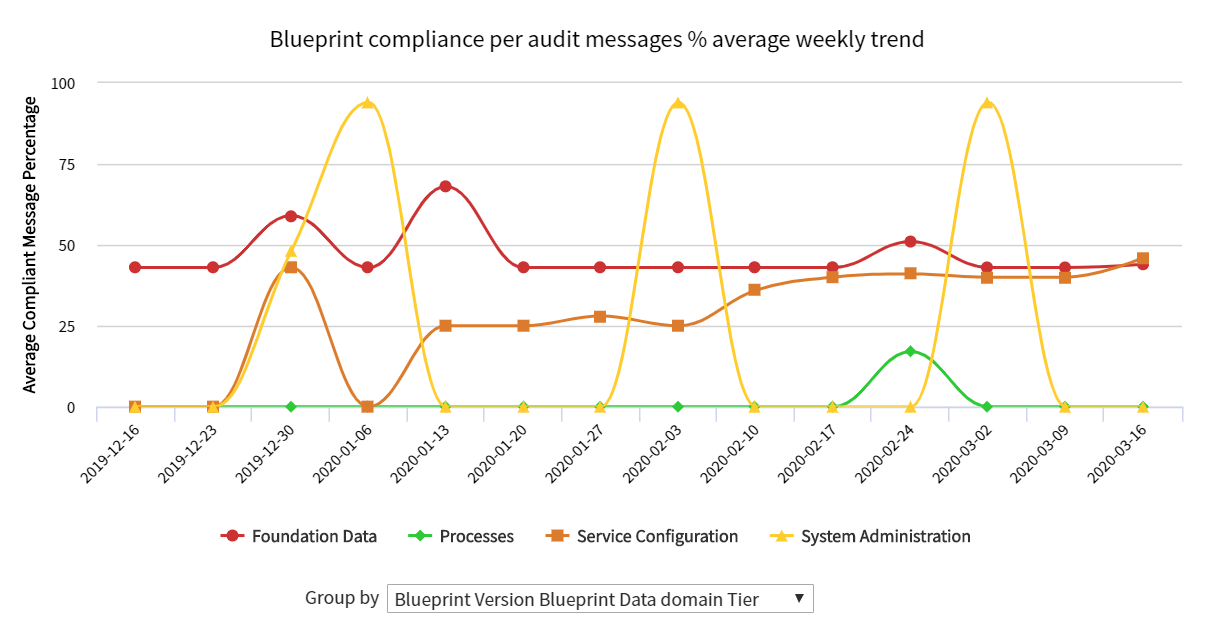
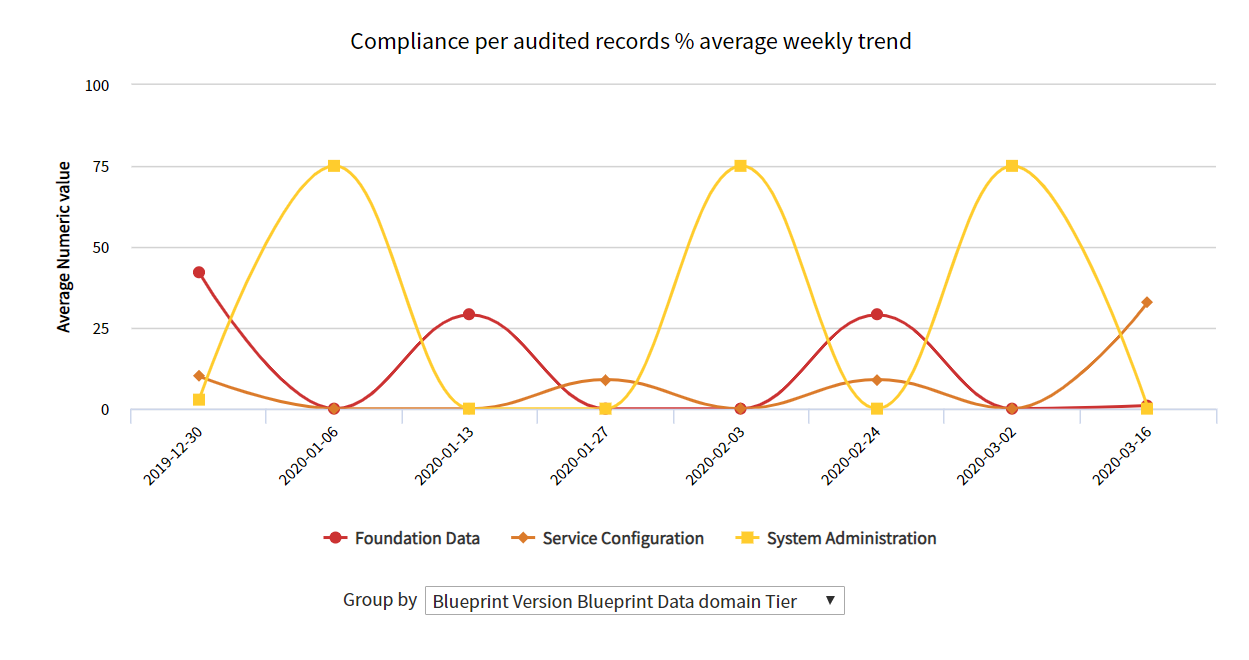
| 15 | Data Compliance - Weekly Trend DCM - Blueprint compliance per audit messages % average weekly trend |
| Spline | x_jugr_dcm_... audit_instance | Data compliance trend based on audit messages as a weekly trend. Average means that if the same audit has been run multiple times during the week, then an average result is shown. Default grouping per Data Tier. Each audited record will generate multiple audit messages, so this trend should show more positive values than the other trend report that is based on audited record compliance. Trend timeline should be selected based on audit schedule or when the results are being reviewed (weekly or monthly for example). | IN USE Renamed in R4.5 | Audit - Data Quality - Weekly Overview |
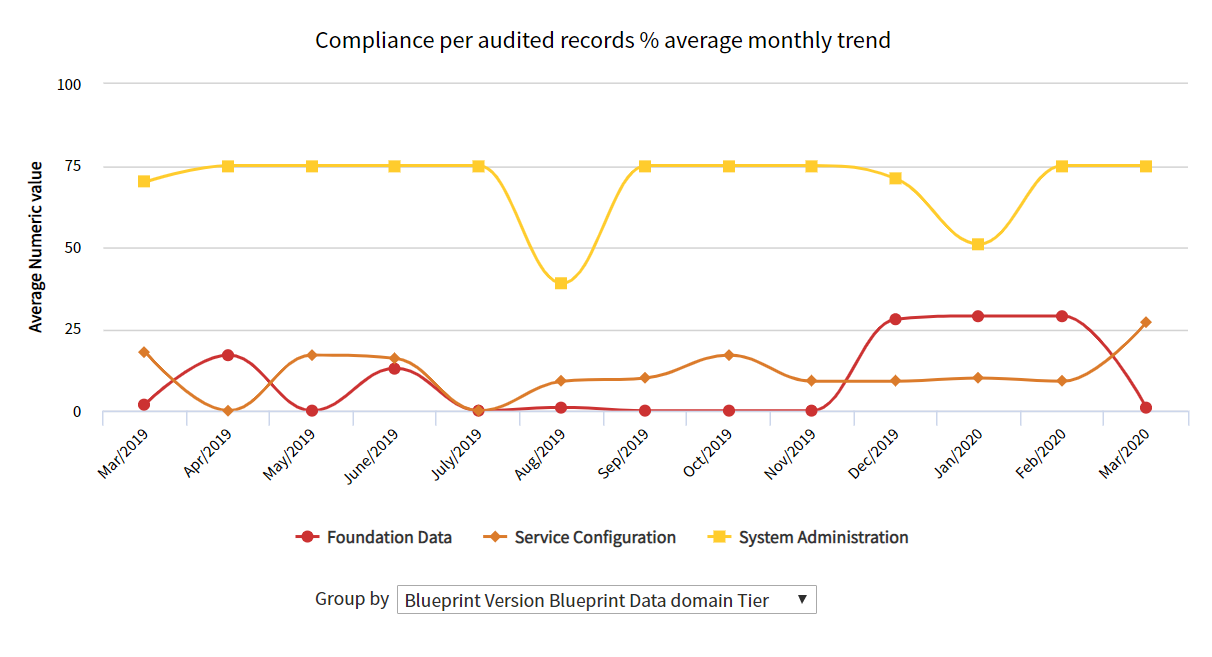
| 16 | Data Compliance - Monthly Trend DCM - Blueprint compliance per audit messages % average monthly trend | Spline | x_jugr_dcm_... audit_instance | Data compliance trend based on audit messages as a monthly trend. Average means that if the same audit has been run multiple times during the month, then an average result is shown. Default grouping per Data Tier. Each audited record will generate multiple audit messages, so this trend should show more positive values than the other trend report that is based on audited record compliance. Trend timeline should be selected based on audit schedule or when the results are being reviewed (weekly or monthly for example). | NEW New in R5.1.1 | Audit - Data Quality - Monthly Overview | |
| 17 | Data Compliance - Weekly Trend DCM - Data Compliance - Weekly Trend based on Audit Results | Spline | x_jugr_dcm_... audit_results | Basically the same report as "Data Compliance - Weekly Trend" created based on Audit Instances table, but this one is based on Audit Results table. This version of the report allows us to use Interactive Filters related to Audit Results like Data Providers, but this is slower to generate. In instances where number of Audit Results is very high, it's recommended to use the Audit Instance based version of the report. | IN USE | Audit - My Data Domains | |
| 18 | My Data Compliance - Weekly Trend DCM - My Domains - Blueprint compliance per audit messages % average weekly trend | Spline | x_jugr_dcm_... audit_results | Same as "Data Compliance - Weekly Trend", but filtered based on Data Domains related to current user. This report is based on Audit Results, so it provides easy access to more detailed audit results and messages. Usage: See data compliance trends in more detail on areas that you are responsible for (or otherwise related to). No need to create separate reports per domain, when you can simply relate users to different domains. | IN USE | NO | |
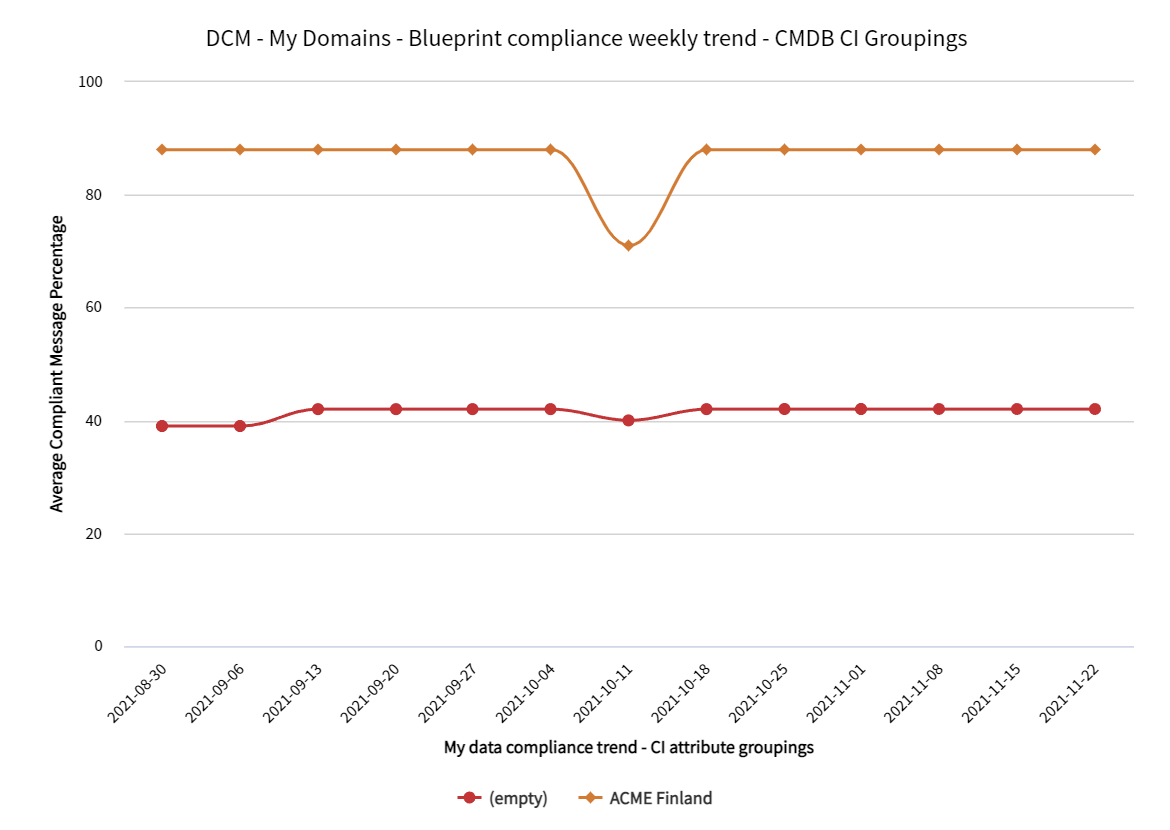
| 19 | My CMDB Data Compliance - CI Attribute Grouping - Weekly Trend DCM - My Domains - Blueprint compliance weekly trend - CMDB CI Groupings |
| Spline | x_jugr_dcm_... audit_result_to_root | Same as "My Data Compliance - Weekly Trend", but based on Database View that joins Audit Results with Configuration Items. Filtered based on Data Domains related to current user. Usage: this report provides additional grouping and filtering capability using attributes available on the Configuration Item (cmdb_ci) table. This report only includes Audit Results where the Root Class is inherited from the Configuration Item table. | NEW New in R5.1.1 | NO |
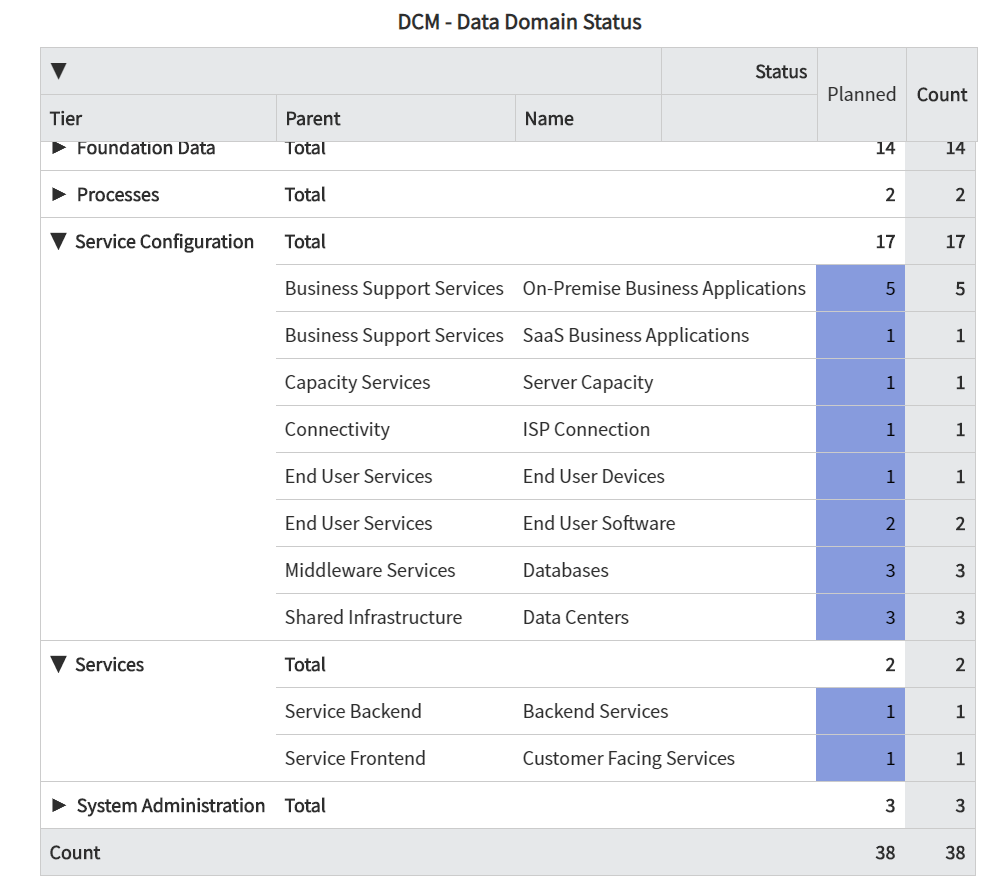
| 20 | DCM - Data Domain Status DCM - Data Domain Status |
| Multilevel pivot | x_jugr_dcm_... data_domain_blueprints | This table is showing status for different data domains. Each domain will have a minimum count 1, but of domain already has blueprints defined those will increase the count. The purpose of this report is to work as a planning and scoping tool for data domains. | IN USE | Blueprints - Overview |
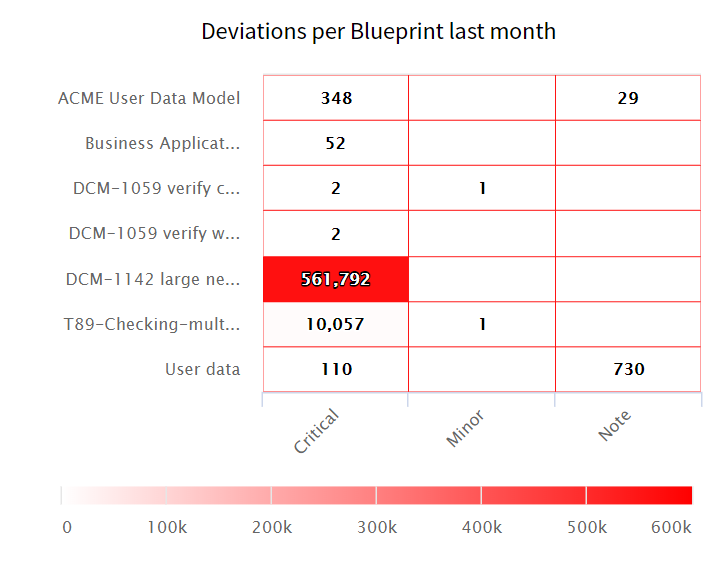
| 21 | Deviations per Blueprint last month DCM - Deviations per Blueprint last month |
| Heatmap | x_jugr_dcm_audit_results | The number of deviations on different levels per blueprint for the last month. | IN USE | NO |
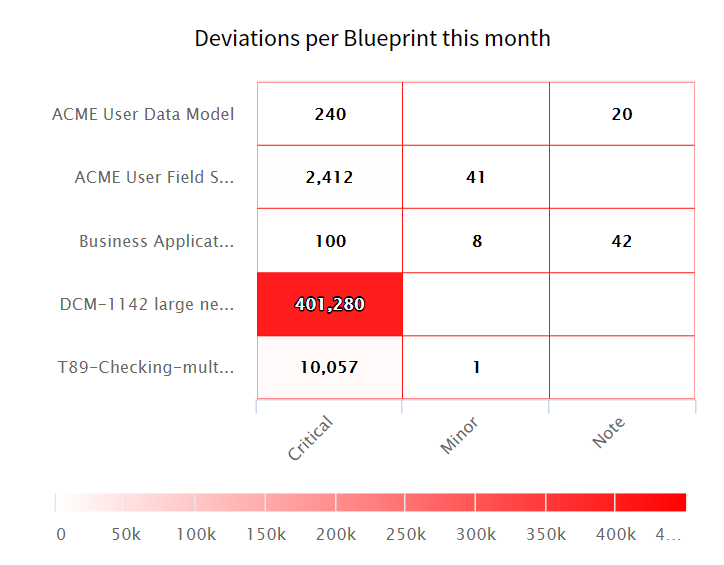
| 22 | Deviations per Blueprint this month DCM - Deviations per Blueprint this month |
| Heatmap | x_jugr_dcm_audit_results | The number of deviations on different levels per blueprint for the current month. This report drills down to table level and then further down to blueprint based trend graph for the month. | IN USE | NO |
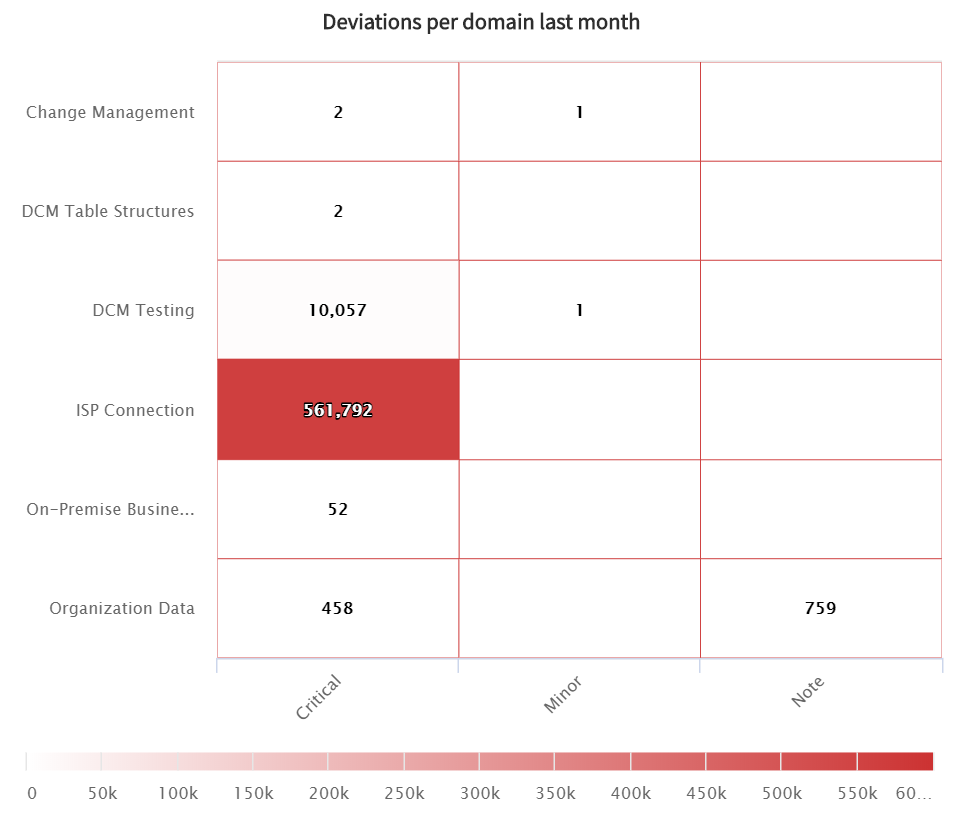
| 23 | Deviations per domain last month DCM - Deviations per domain last month |
| Heatmap | x_jugr_dcm_audit_results | The number of deviations on different levels per data domain for the previous month. This report drills down to table level and then further down to blueprint based trend graph for the month. | IN USE | NO |
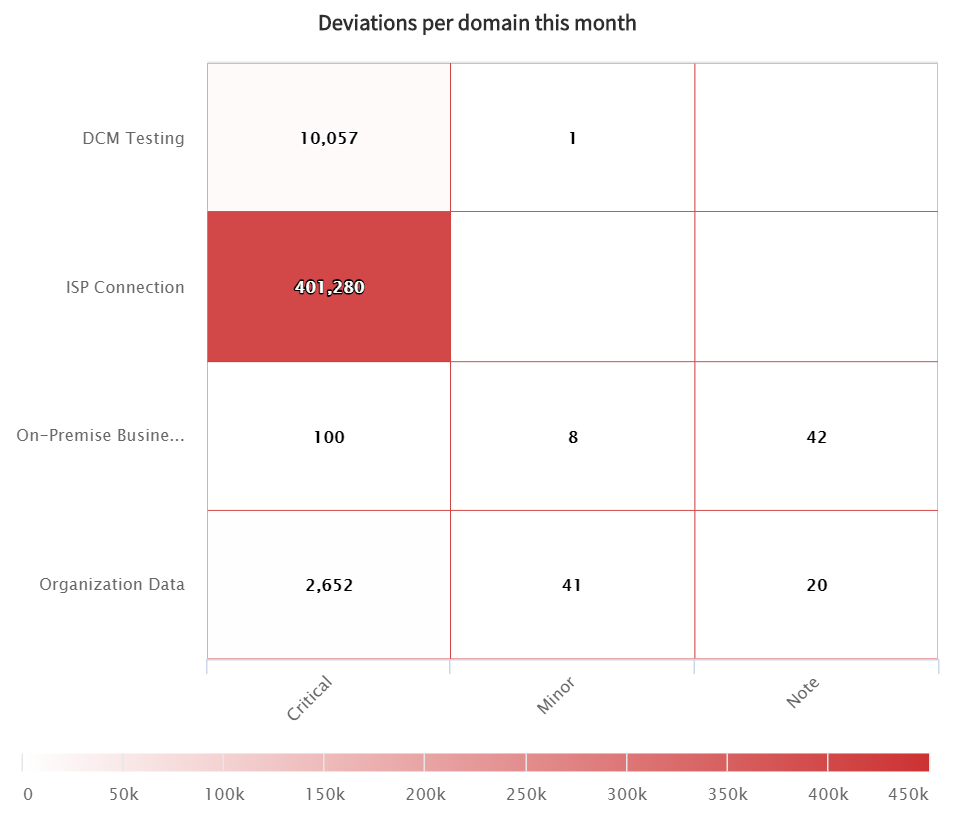
| 24 | Deviations per domain this month DCM - Deviations per domain this month |
| Heatmap | x_jugr_dcm_audit_results | The number of deviations on different levels per data domain for the current month. This report drills down to table level and then further down to blueprint based trend graph for the month. | IN USE | NO |
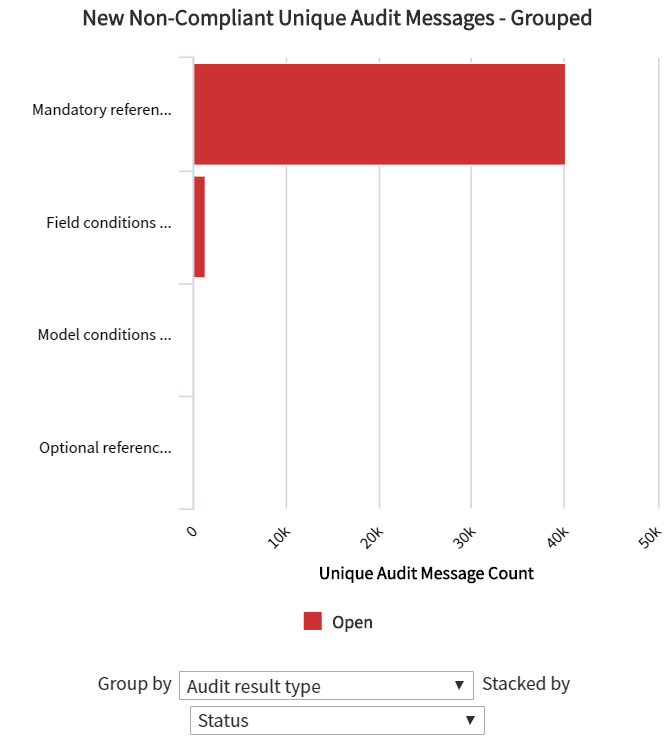
| 25 | New Non-Compliant Unique Audit Messages - Grouped DCM - New Non-Compliant Unique Audit Messages - Grouped |
| Horizontal bar | x_jugr_dcm_... unique_audit_message | Non-compliant unique audit messages created within the last 30 days grouped by Audit result type. Other grouping options include deviation level, blueprint element, class, real record, audited record and status. | IN USE | NO |
| 26 | Non-Compliant Unique Audit Messages per CI Managed by DCM - Unique Audit Messages per CI Managed by |
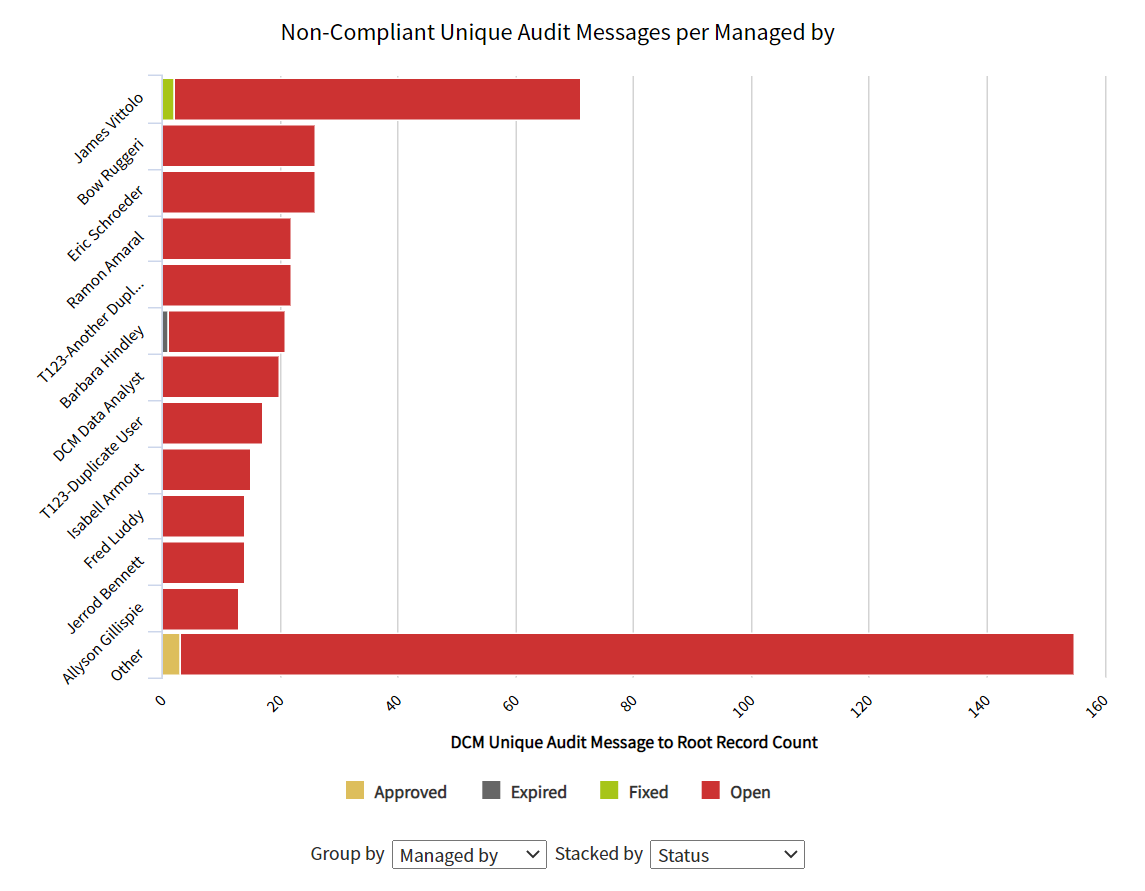
| Horizontal bar | x_jugr_uam_to_root | Example report for using the "DCM Unique Audit Message to Root Record" database view that connects Configuration Items as Audited records to Unique Audit Messages. Through this DB View, reports can include common attributes from the Configuration Item table. This report is using the Managed by reference from CI table to group the non-compliant Unique Audit Messages. Usage: Use this report as an example to create your own reports that would combine CI Attributes and UAM data. | IN USE | NO |
| 27 | Non-Compliant Unique Audit Messages - Grouped DCM - Non-Compliant Unique Audit Messages - Grouped |
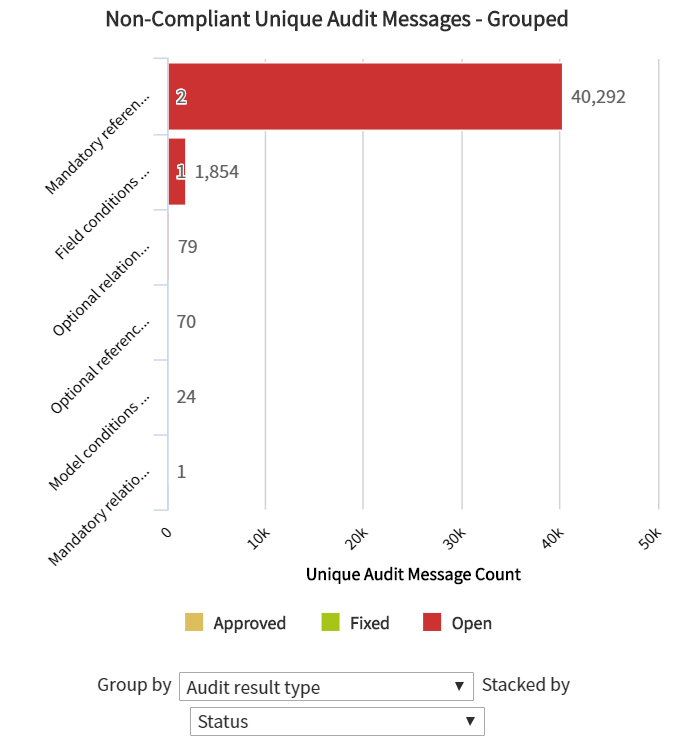
| Horizontal bar | x_jugr_dcm_... unique_audit_message | Non-compliant unique audit messages from the last 6 months grouped by the audit result type. Other grouping options include blueprint element, class, real record, audited record and status for example. | IN USE | NO |
| 28 | Non-Compliant Unique Audit Messages in CMDB - Grouped DCM - Non-Compliant Unique Audit Messages in CMDB - Grouped |
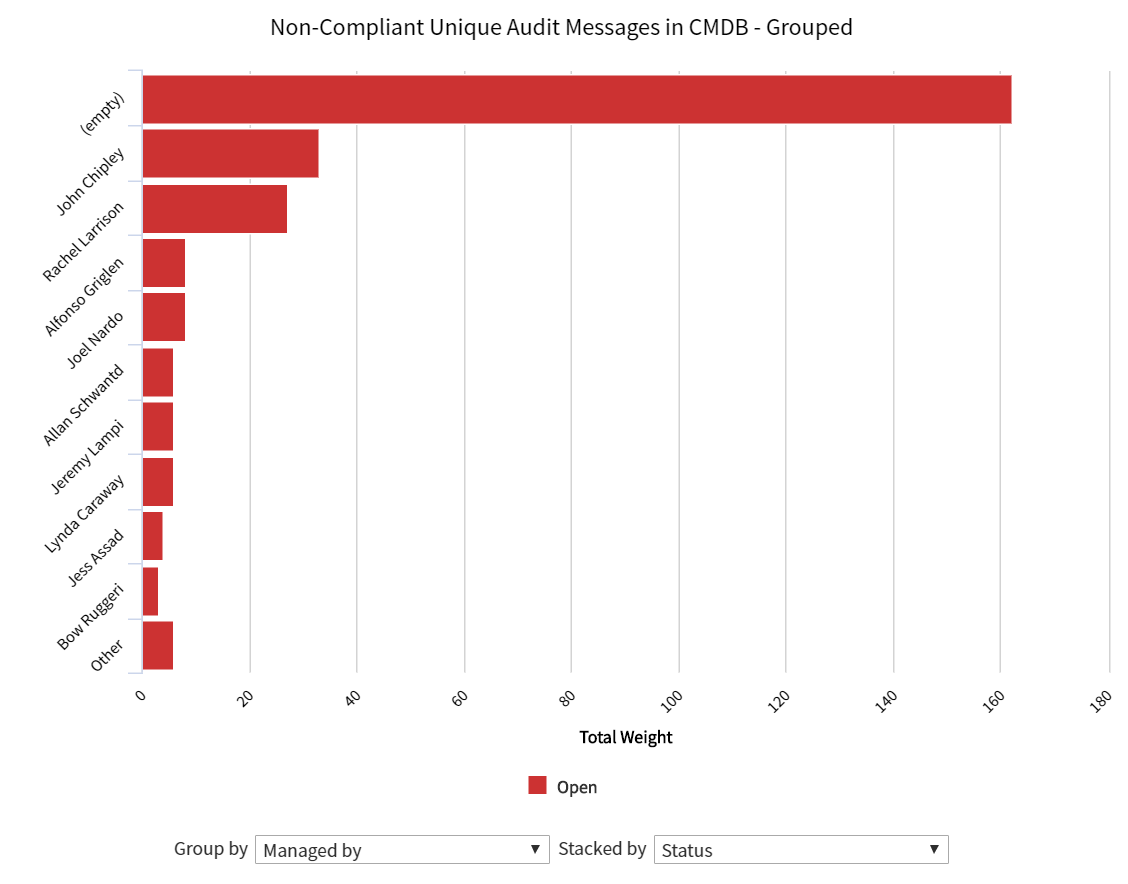
| Horizontal bar | x_jugr_dcm_... uam_to_real_records | Non-compliant unique audit messages from the last 3 months grouped by the Managed by field on the Real record related to the unique audit message. This is an example report that uses a database view that connects audit messages into configuration items. This DB view allows using CI attributes as grouping factors. Usage: Use this report as an example to create your own reports that would combine CI Attributes and UAM data. | IN USE | NO |
| 29 | Non-Compliant Unique Audit Messages per Class DCM - Non-Compliant Unique Audit Messages per Class |
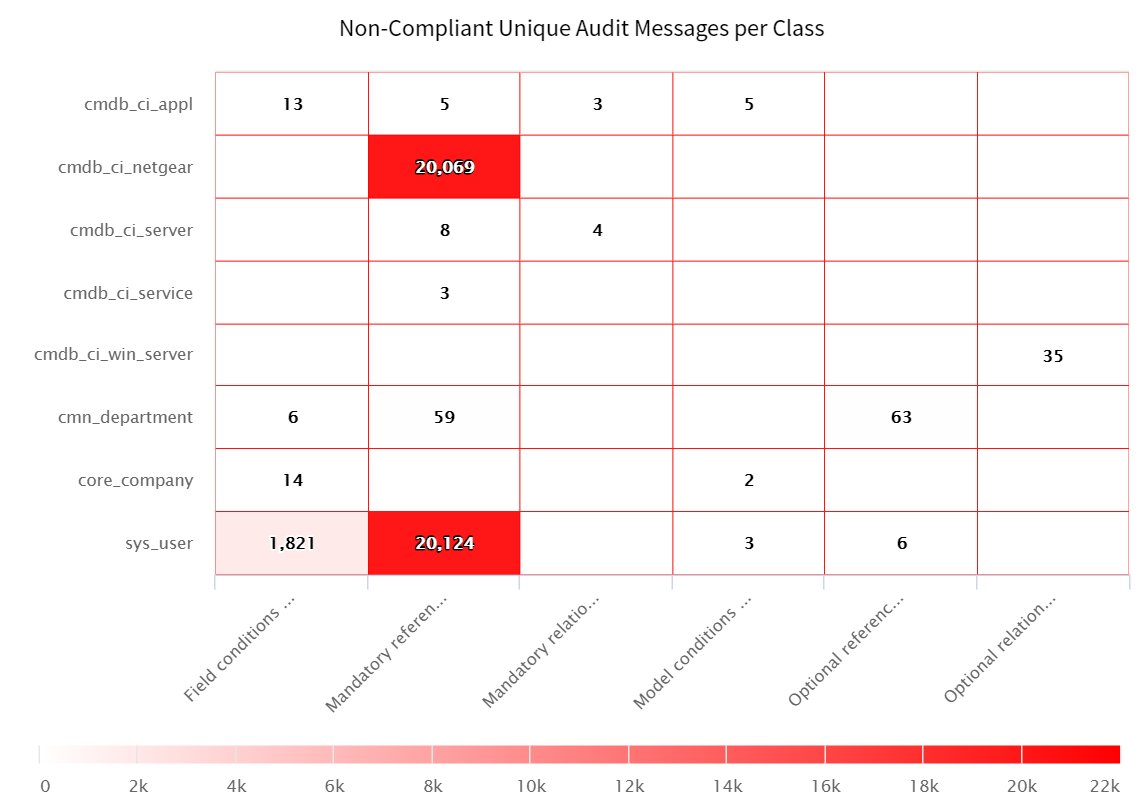
| Heatmap | x_jugr_dcm_... unique_audit_message | The number of non-compliant unique audit messages for the last 3 months per class and audit result type. | IN USE | NO |
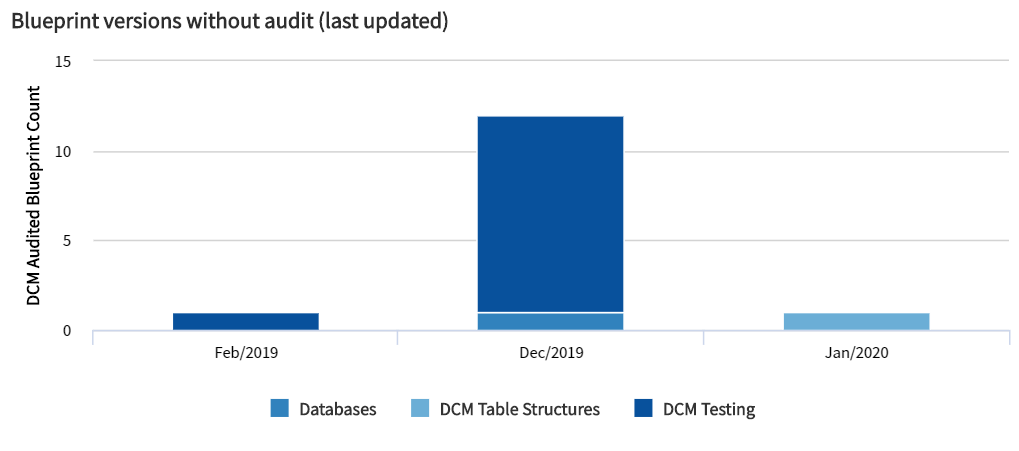
| 30 | Blueprint versions without audit (last updated) DCM - Published blueprints without audits |
| Column | x_jugr_dcm_... audited_blueprints | Published blueprint versions that has not been used for an audit trend based on their last updated date. Usage: This report can be used to identify out-dated blueprint versions that could be deleted in order to optimize DCM license usage. | IN USE | Blueprints - Overview |
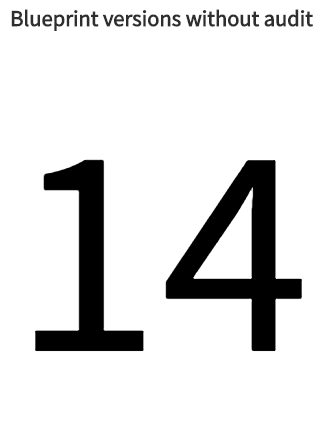
| 31 | Blueprints without audit DCM - Published blueprints without audits |
| Single score | x_jugr_dcm_... audited_blueprints | The total number of published blueprint versions that have never been used for audit. Usage: This report can help in optimizing the DCM license usage. | IN USE | Blueprints - Overview |
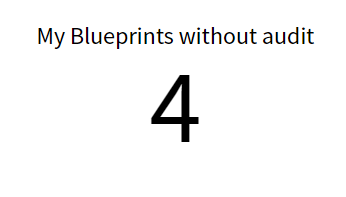
| 32 | My Blueprints with audit DCM - My Published blueprints without audits |
| Single score | x_jugr_dcm_... audited_blueprints | Same as "Blueprints without audits", but filtered based on Blueprint versions related to current user. | IN USE | Blueprints - My Blueprints |
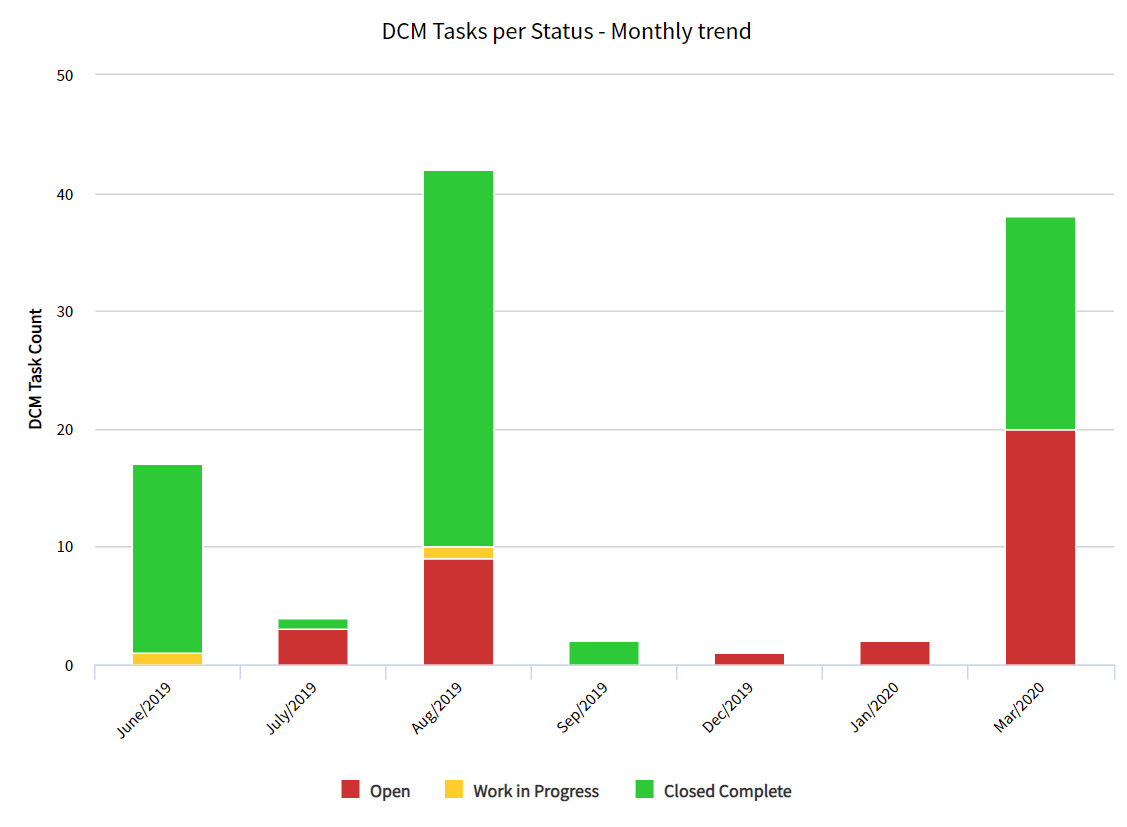
| 33 | DCM Tasks per Status - Monthly trend DCM Tasks - DCM Tasks per Status - Monthly trend |
| Trend | x_jugr_dcm_task | Number of DCM Tasks created each month grouped by current status. Alternative time frame for the weekly report. | IN USE | NO |
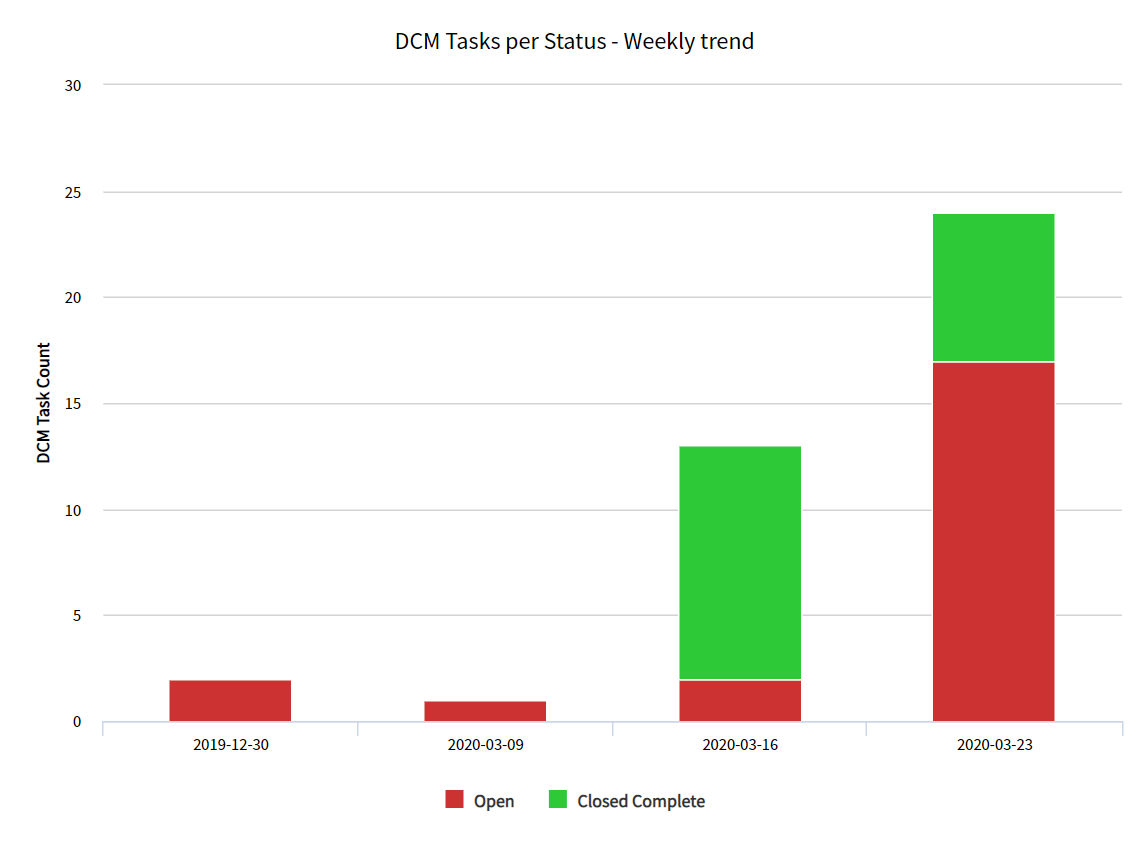
| 34 | DCM Tasks per Status - Weekly trend DCM Tasks - DCM Tasks per Status - Weekly trend |
| Trend | x_jugr_dcm_task | Number of DCM Tasks created each week grouped by current status. | IN USE | Workspace - Overview |
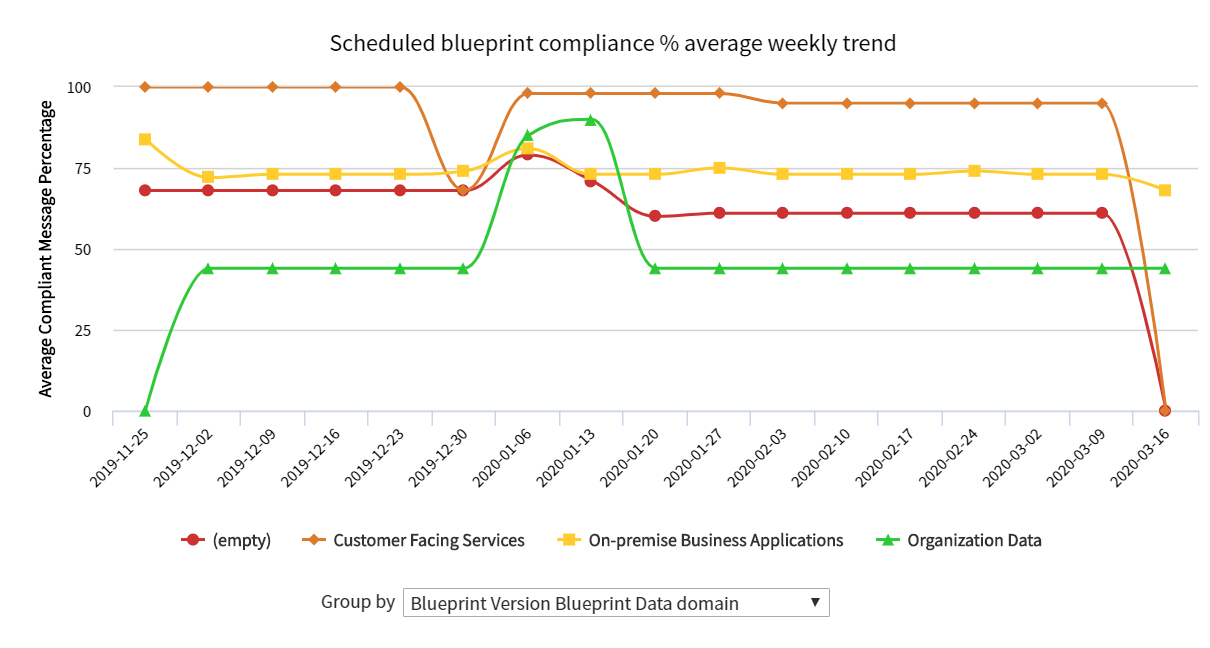
| 35 | Scheduled Blueprint compliance % average weekly trend DCM - Scheduled Blueprint compliance % average weekly trend |
| Spline | x_jugr_dcm_... audit_instance | Data compliance trend based on audit messages as a weekly trend. Average means that if the same audit has been run multiple times during the week, then an average result is shown. Default grouping per Data Tier. This is an example report that only includes audit results from scheduled audits. | IN USE | NO |
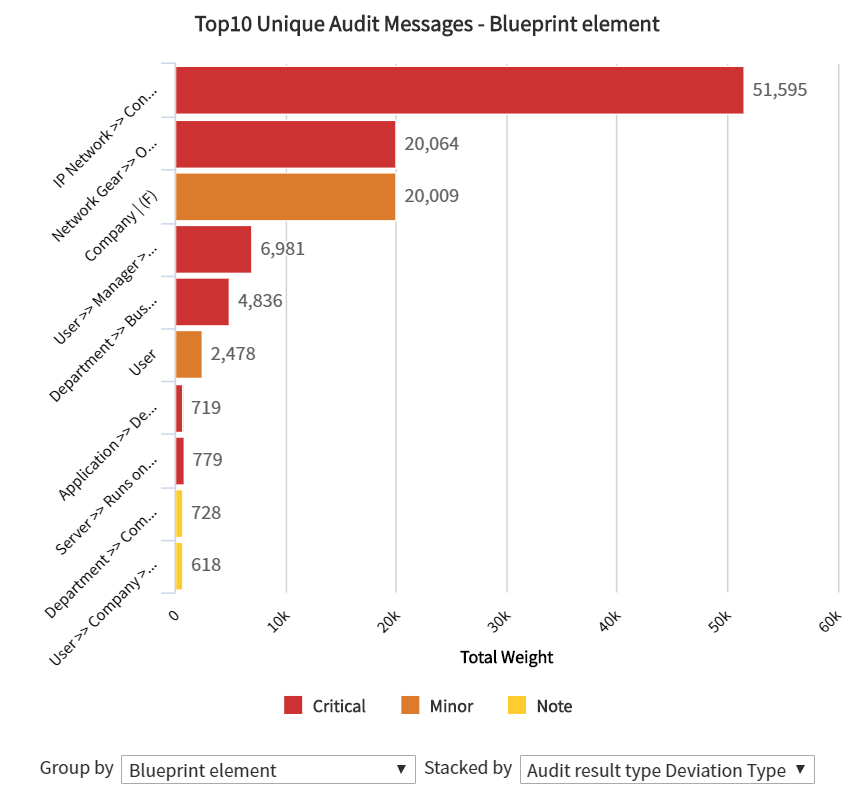
| 36 | Top10 Unique Audit Messages - Blueprint element DCM - Top10 Unique Audit Messages - Blueprint element |
| Horizontal bar | x_jugr_dcm_... unique_audit_message | Top10 blueprint elements with most weight on related deviations. This basically means that these parts of the blueprints have most issues and maybe should be checked and fixed first. Also meaning that fixing these issues should have the most impact on overall data quality. This report includes unique audit messages that have been updated within the last 30 days. | IN USE | NO |
| 37 | Top10 Records with Most Deviations DCM - Top10 Records with Most Deviations | 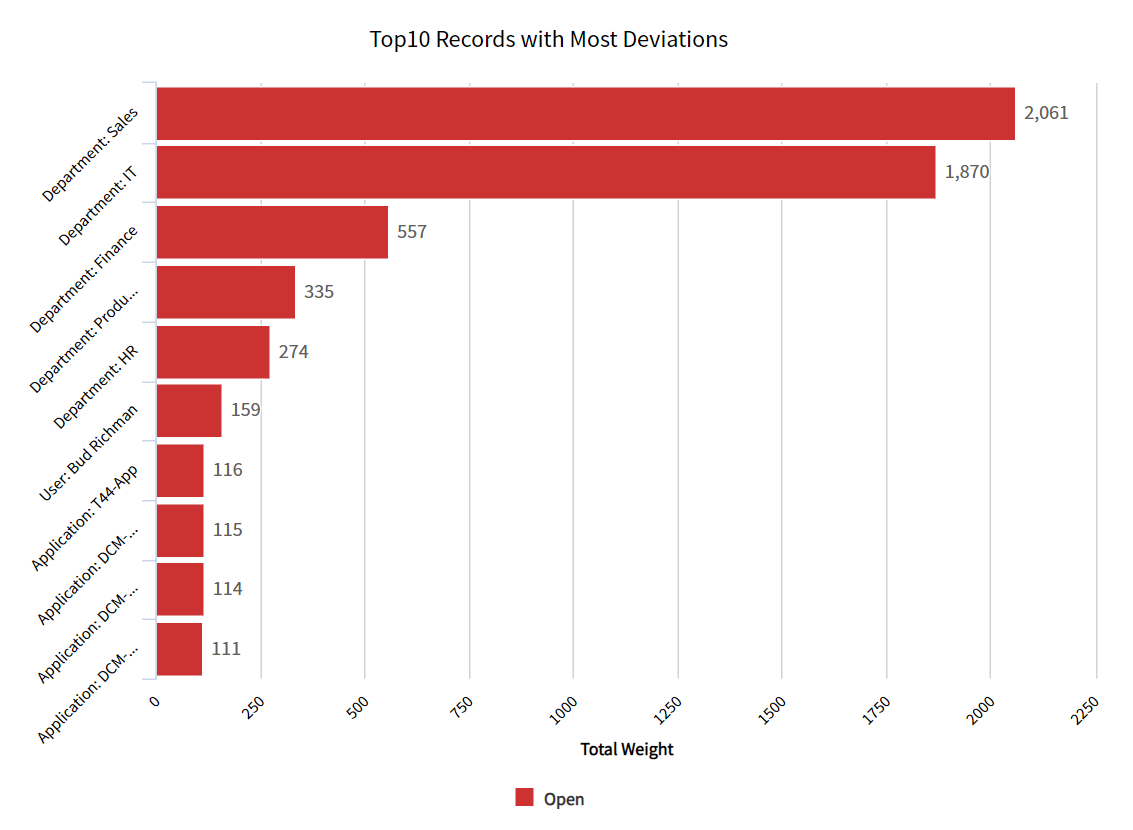 | Horizontal bar | x_jugr_dcm_... unique_audit_message | Top10 real records with most weight on related deviations. This basically means that these records have most issues and maybe should be checked and fixed first. Also meaning that fixing these records should have the most impact on overall data quality. This report includes Open Unique audit messages that have been updated within the last 30 days. | IN USE | Audit - Data Quality - Weekly Overview |
| 38 | Top10 Records with Most Deviations DCM - Top10 Records with Most Deviations | Horizontal bar | x_jugr_dcm_... unique_audit_message | Same as "Top10 Records with Most Deviations", but filtered based on Data Domains related to current user. | IN USE | Audit - My Data Domains | |
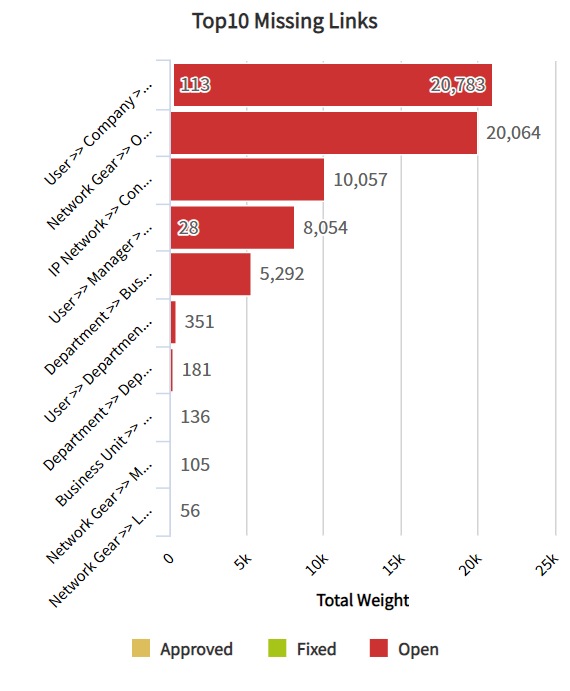
| 39 | Top10 Missing links DCM - Top10 Unique Audit Messages - Missing links |
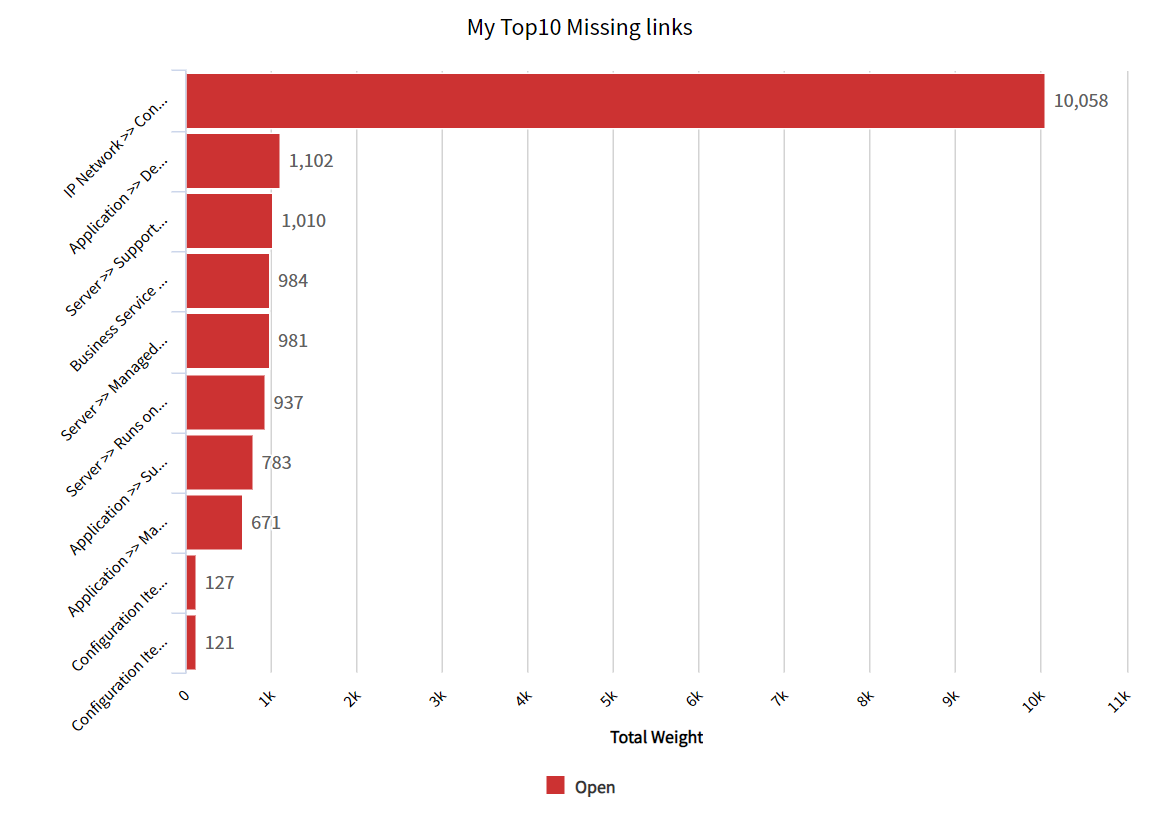
| Horizontal bar | x_jugr_dcm_... unique_audit_message | Top10 blueprint elements for references and relationships with most weight on related deviations. This basically means that these links have most issues and maybe should be checked and fixed first. Also meaning that fixing these issues should have the most impact on overall data quality. This report includes Open Unique audit messages that have been updated within the last 30 days. | IN USE | Audit - Data Quality - Weekly Overview |
| 40 | My Top10 Missing Links DCM - My Domains - Top10 Unique Audit Messages - Missing links |
| Horizontal bar | x_jugr_dcm_... unique_audit_message | Same as "Top10 Records with Most Deviations", but filtered based on Data Domains related to current user. | IN USE | Audit - My Data Domains |
| 41 | Top10 Unique Audit Messages - Real record DCM - Top10 Unique Audit Messages - Real record |
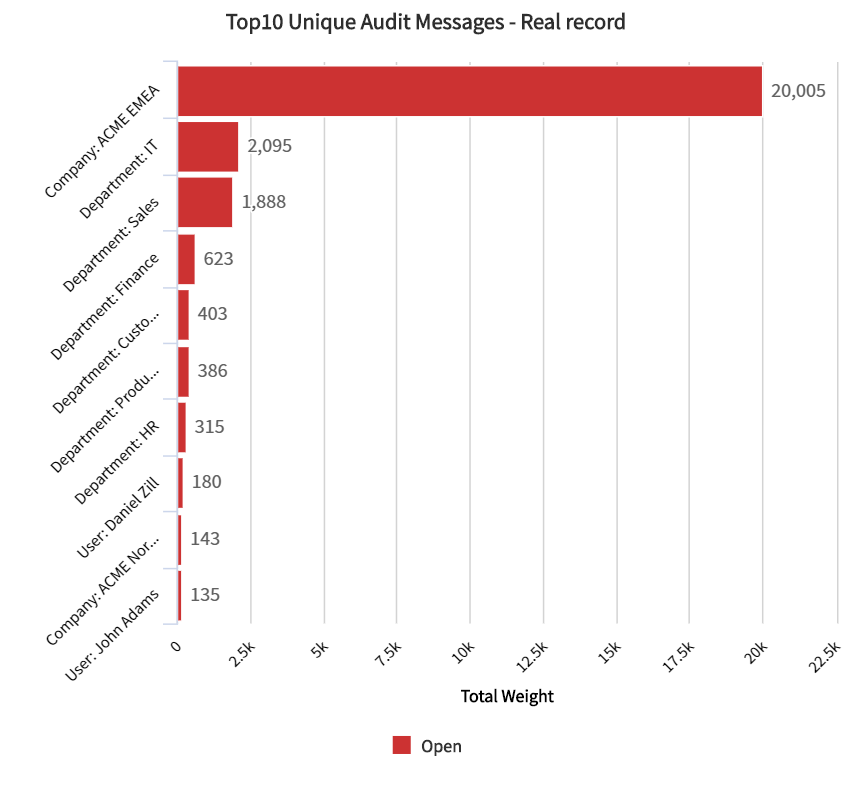
| Horizontal bar | x_jugr_dcm_... unique_audit_message | This report is basically replaced by the "Top10 Records with Most Deviations | IN USE | NO |
| 42 | Top10 Unique Audit Messages - Audited record DCM - Top10 Unique Audit Messages - Audited record |
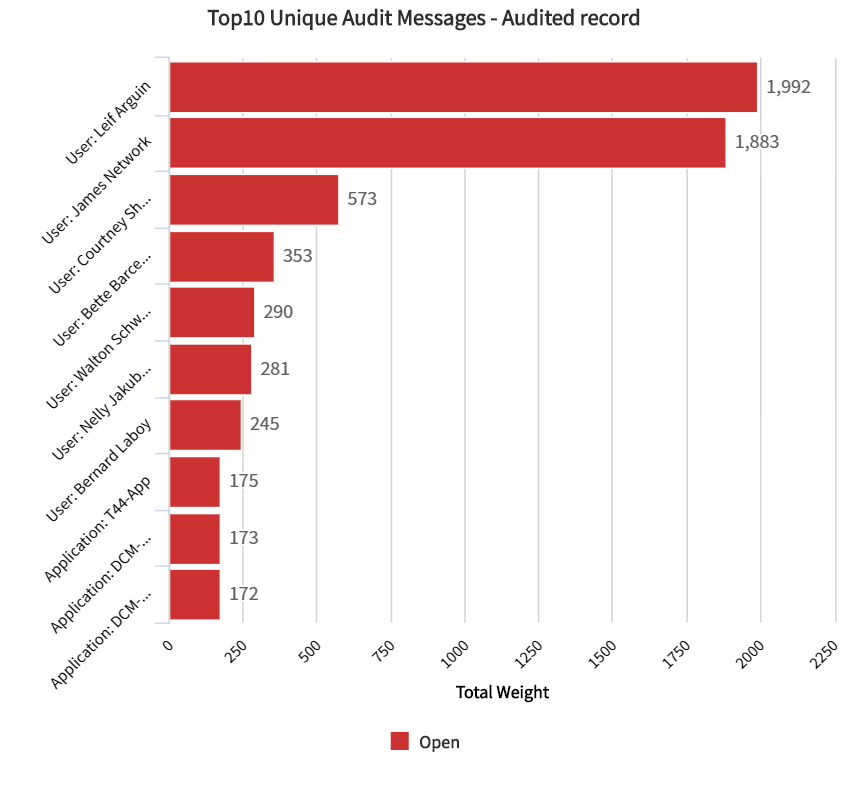
| Horizontal bar | x_jugr_dcm_... unique_audit_message | Top10 record with most weight on related deviations. This basically means that these individual records have most issues and maybe should be checked and fixed first. Also meaning that fixing these records should have the most impact on overall data quality. Links to audited records are based on the last audited record, since same audit message may have been discovered via different root records on different audit instances. This report includes unique audit messages that have been updated within the last 30 days. | IN USE | NO |
| 43 | Unique Audit Messages - Aging DCM - Unique Audit Messages - Aging |
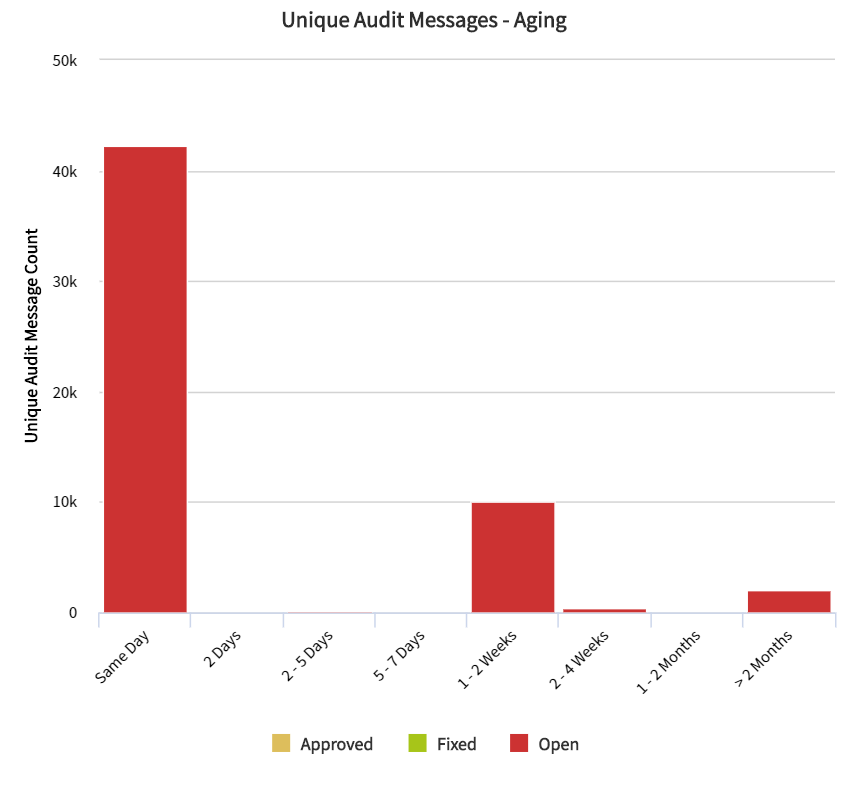
| Bar | x_jugr_dcm_... unique_audit_message | Non-compliant unique audit messages aging report is showing how UAMs are getting old. Old UAM basically means it has not been updated by any recent audit and therefore it may be obsolete. This may be because the issues have been fixed and audit simply doesn't find the same issues anymore or the records and blueprints are not being audited anymore. The report includes all Open messages and all non-compliant that have been updated within the last 30 days. Meaning that Fixed or Approved messages will be dropped out from the report after 30 days. | IN USE | NO |
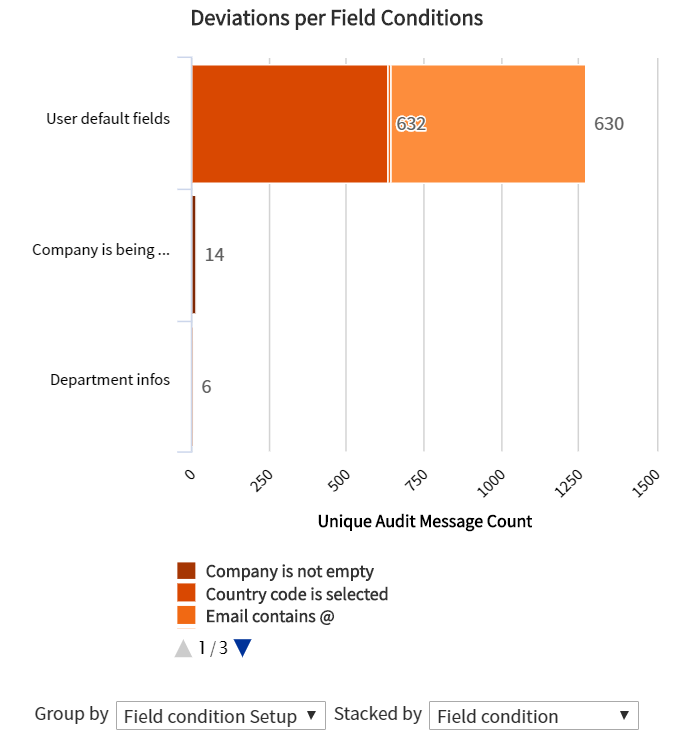
| 44 | Deviations per Field Conditions DCM - Unique Audit Messages per Field Condition |
| Horizontal bar | x_jugr_dcm_... unique_audit_message | Deviations related to Field conditions grouped by the Field setup and condition. A blueprint should have a Field setup related to one or more containers before audit can check the field level conditions. This report is showing which individuals fields on different tables are causing most issues. | IN USE | Audit - Data Quality - Weekly Overview |
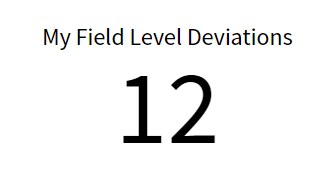
| 45 | My Field Level Deviations DCM - My Domains - Field Level Deviations |
| Single score | x_jugr_dcm_... unique_audit_message | Total number of Field level deviations under "my domains". | IN USE | NO |
| 46 | My Deviations per Field Conditions DCM - My Domains - Unique Audit Messages per Field Condition | Horizontal bar | x_jugr_dcm_... unique_audit_message | Same as "Deviations per Field Condition", but filtered based on Data Domains related to current user. | IN USE | Audit - My Data Domains | |
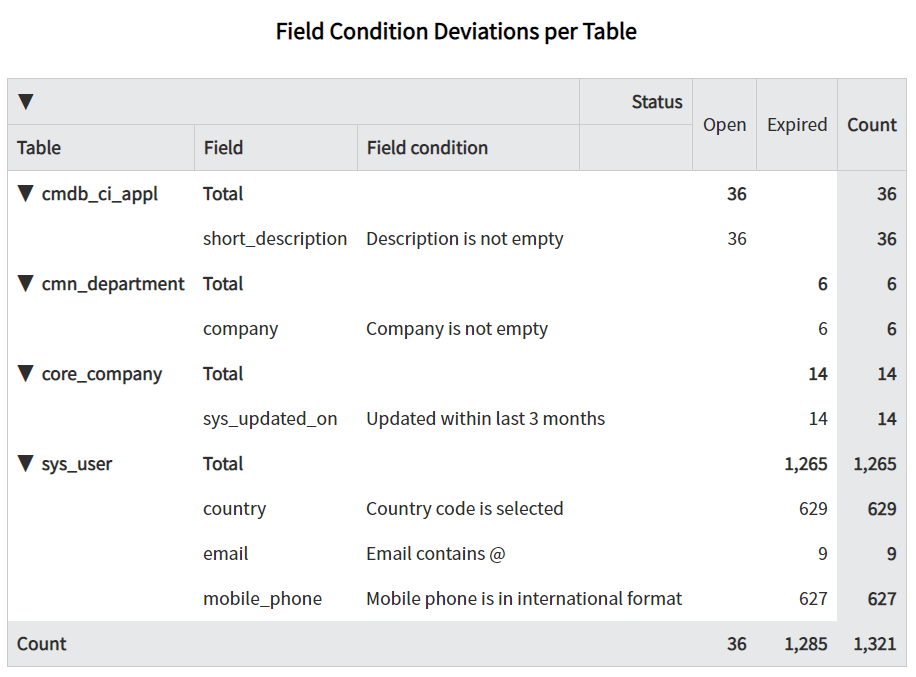
| 47 | Field Condition Deviations per Table DCM - Field Condition Deviations per Table |
| Multilevel pivot | x_jugr_dcm_... unique_audit_message | Deviations related to Field conditions shown as a pivot table. Grouping on rows is based on table and field while columns show the UAM Status. This report is showing how many issues individuals fields on different tables have. | IN USE | NO |
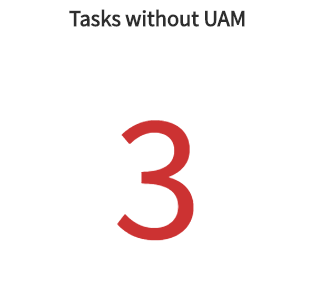
| 48 | Tasks without UAM DCM Admin - Tasks without Unique Audit Messages |
| Single score | x_jugr_dcm_task | Administrative report to identify tasks that do not have any unique audit messages connected to them. These tasks are no longer valid and should be closed or deleted. This report should show 0 when everything is OK. | IN USE | Workspace - Overview |
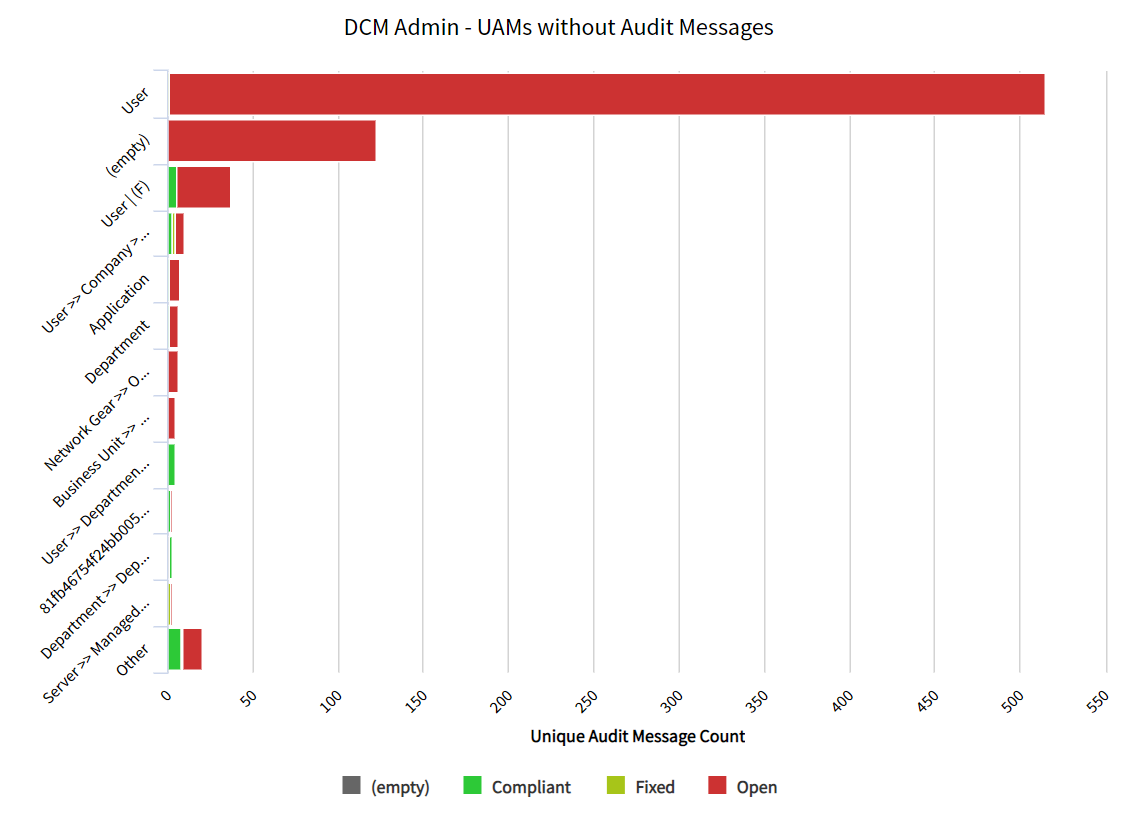
| 49 | UAMs without Audit Messages DCM Admin - UAMs without Audit Messages |
| Horizontal bar | x_jugr_dcm_... unique_audit_message | Unique audit messages that are no longer related to any audit messages. This administrative report will identify UAMs that may not be relevant anymore and could be deleted, since all related audit messages are already deleted. Usage: DCM admins can use this report to delete obsolete UAM records. In later DCM versions, these "orphan" UAMs are automatically deleted, when the last audit message gets deleted. | IN USE | NO |
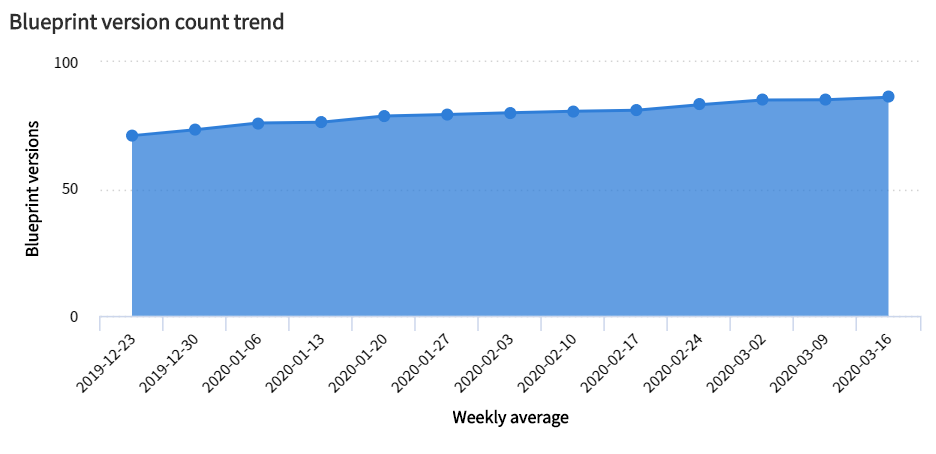
| 50 | Blueprint version count trend DCM Audit - Blueprint version count trend |
| Area | x_jugr_dcm_metric | DCM licensing is based on blueprint version count. This report will track the weekly count of blueprint versions and will be checked as part of DCM license audit. | IN USE | Blueprints - Overview |
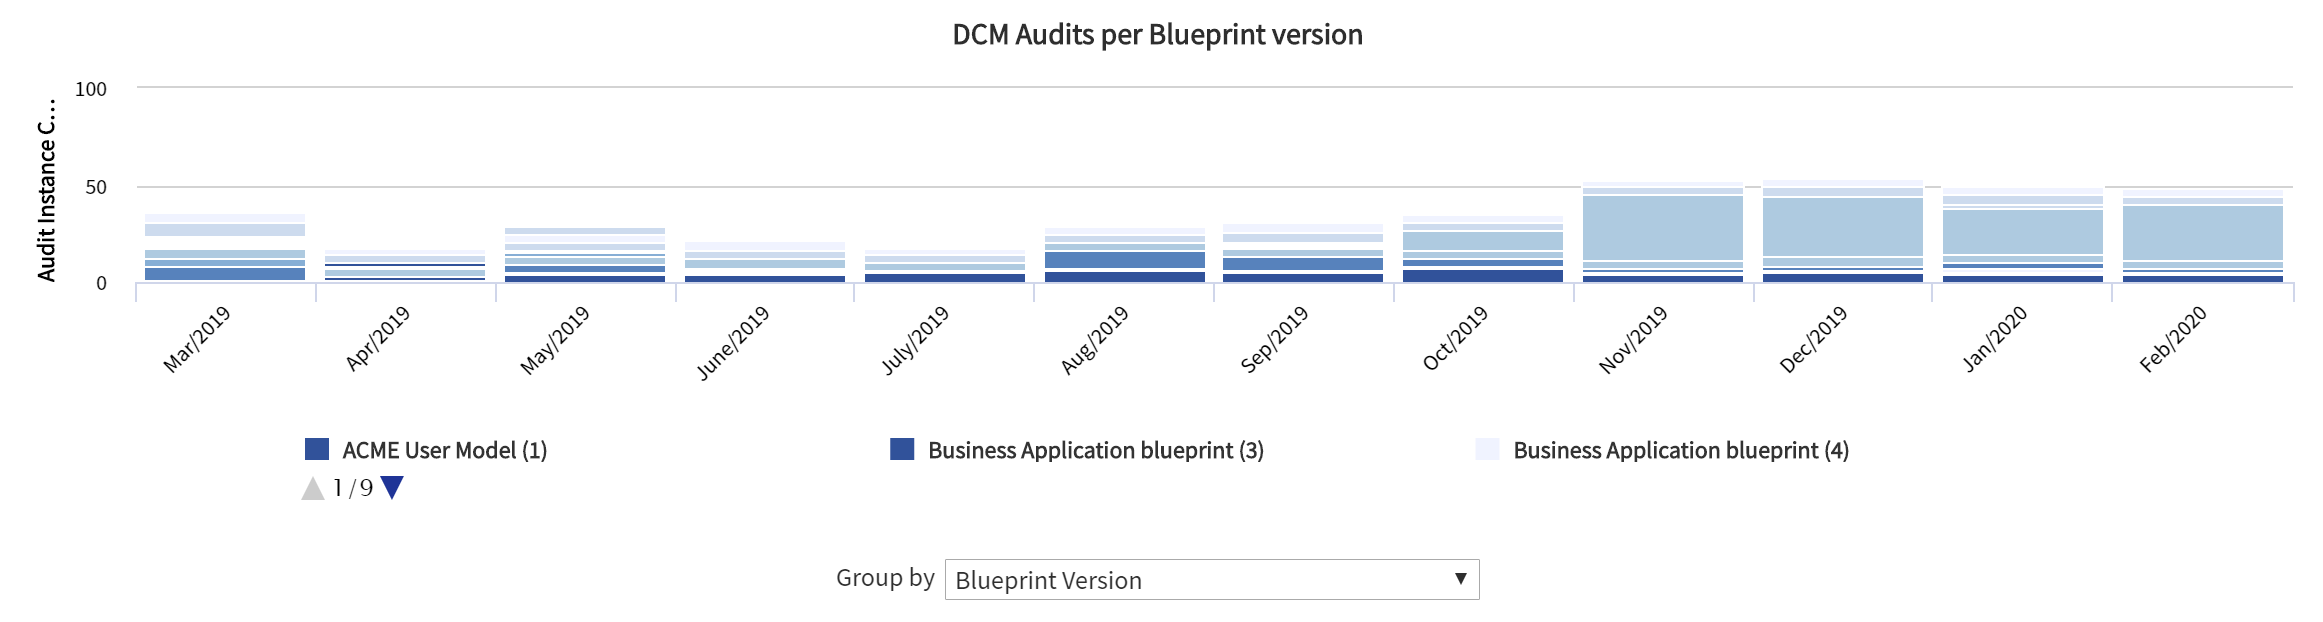
| 51 | DCM Audits per Blueprint version DCM Audits per Blueprint version |
| Trend | x_jugr_dcm_... audit_instance | Trend report showing how many audit instances have been triggered per blueprint as a monthly trend. For example, if a blueprint version is being audited weekly, it should increase the monthly count for blueprint version by four. Idea is to show which blueprints are being used on a regular basis. | IN USE | Blueprints - Overview |
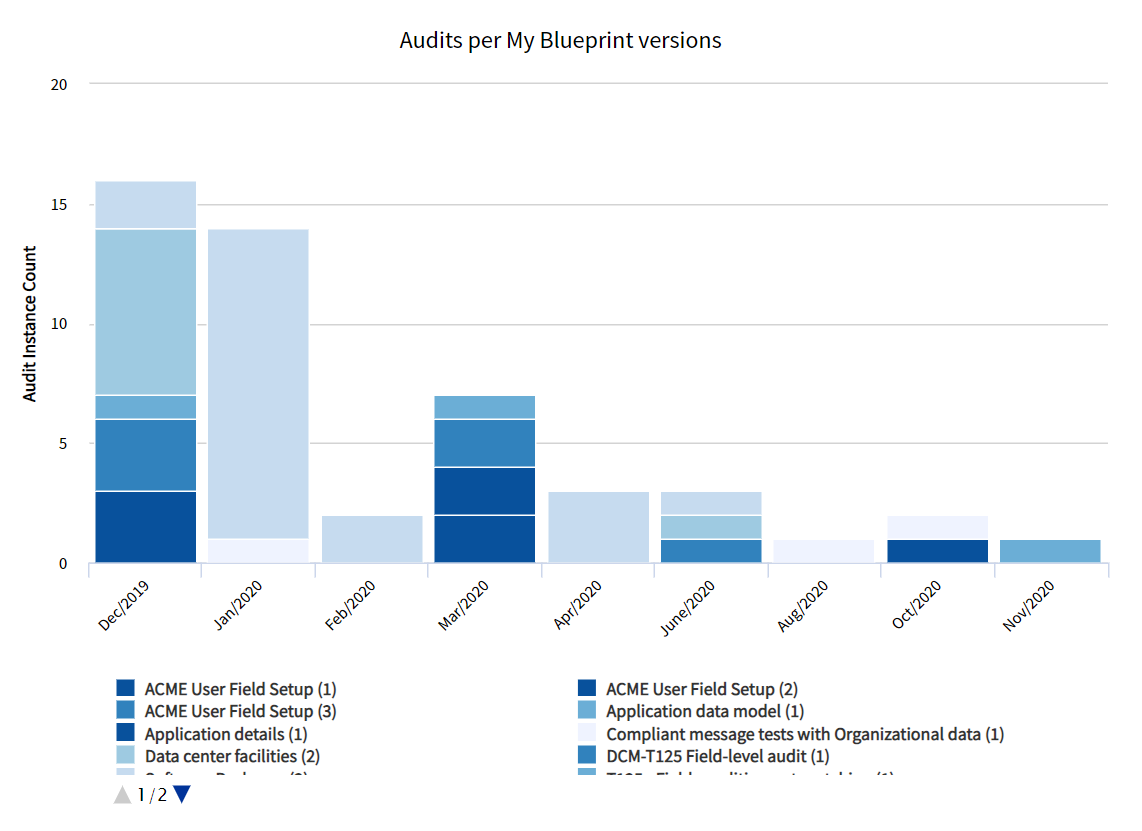
| 52 | DCM Audits per My Blueprint version DCM Audits per My Blueprint version |
| Trend | x_jugr_dcm_... audit_instance | Same as "DCM Audits per Blueprint version", but filtered based on Blueprints related to current user. | IN USE | Blueprints - My Blueprints |
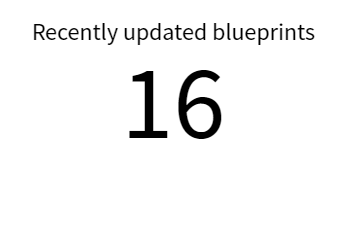
| 53 | Recently updated blueprints DCM - Blueprints updated in last 30 days |
| Single score | x_jugr_dcm_... bp_blueprint_version | Number of blueprints updated within the last 30 days. | IN USE | NO |
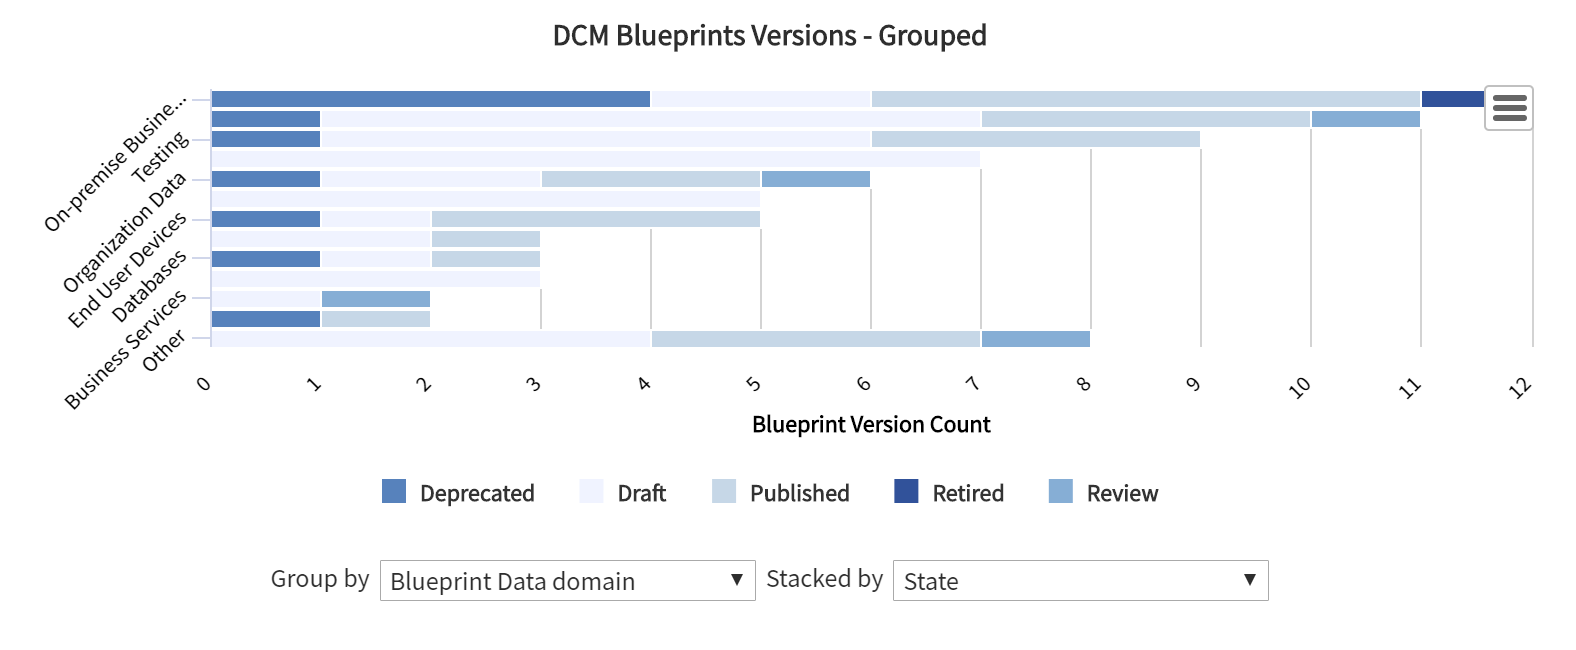
| 54 | Blueprint Versions - Grouped DCM - Blueprint Versions - Grouped |
| Horizontal bar | x_jugr_dcm_... bp_blueprint_version | Blueprint versions grouped by data domain and status. | IN USE | Blueprints - Overview |
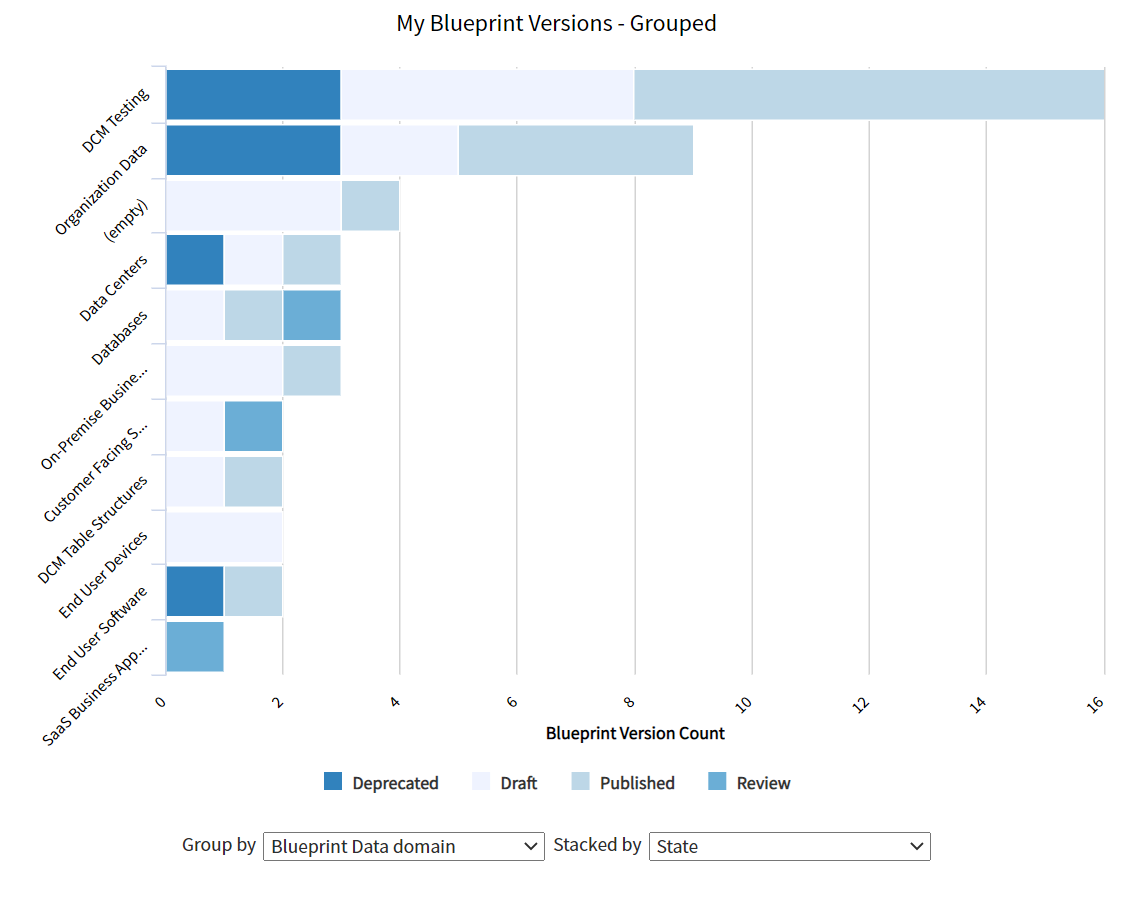
| 55 | My Blueprint Versions - Grouped DCM - My Blueprint Versions - Grouped |
| Horizontal bar | x_jugr_dcm_... bp_blueprint_version | Blueprint versions grouped by data domain and status and filtered based on current user's role related to the blueprint. | IN USE | Blueprints - My Blueprints |
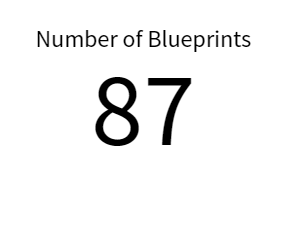
| 56 | Number of Blueprints DCM - Current number of Blueprints |
| Single score | x_jugr_dcm_... bp_blueprint_version | Total number of blueprint versions currently in the instance. This number includes blueprints with all statuses, but it does not include blueprint templates. This is also the number of blueprints that is related to current license plan. Total number of blueprint versions should not exceed to number of allowed blueprint versions based on the DCM subscription. | IN USE | Blueprints - Overview |
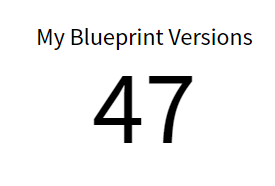
| 57 | My Blueprint versions DCM - My Current number of Blueprint Versions |
| Single score | x_jugr_dcm_... bp_blueprint_version | Same as "Number of Blueprints", but filtered based on Blueprints related to current user. | IN USE | Blueprints - My Blueprints |
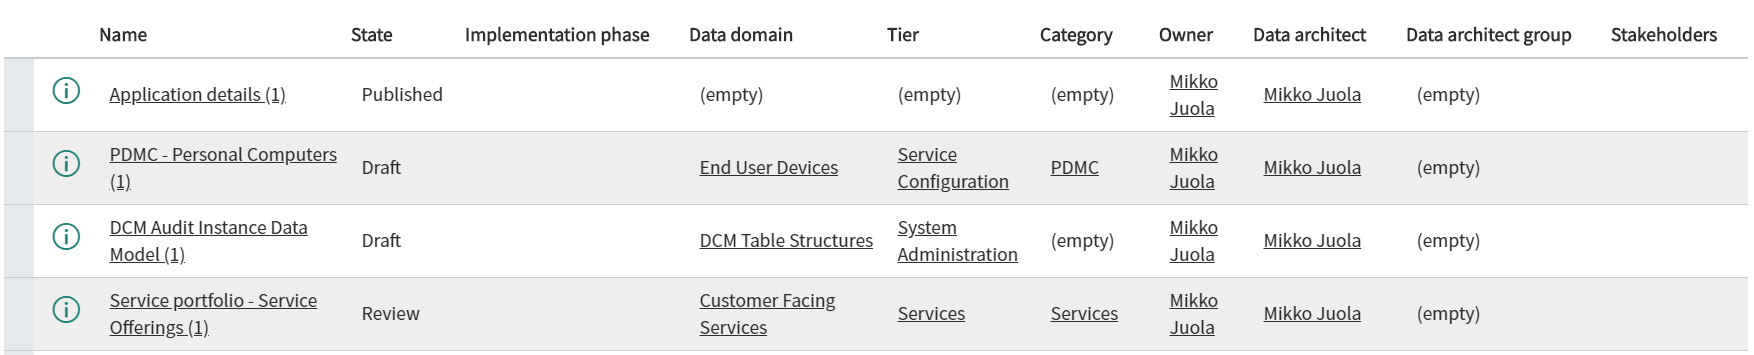
| 58 | DCM - My Blueprint versions DCM - My Blueprint versions |
| List | x_jugr_dcm_... bp_blueprint_version | List of blueprint versions into which the current user is related to. | IN USE | Blueprints - My Blueprints |
| 59 | DCM Task Weight by Assignment DCM Tasks - DCM Task Weight by Assignment | 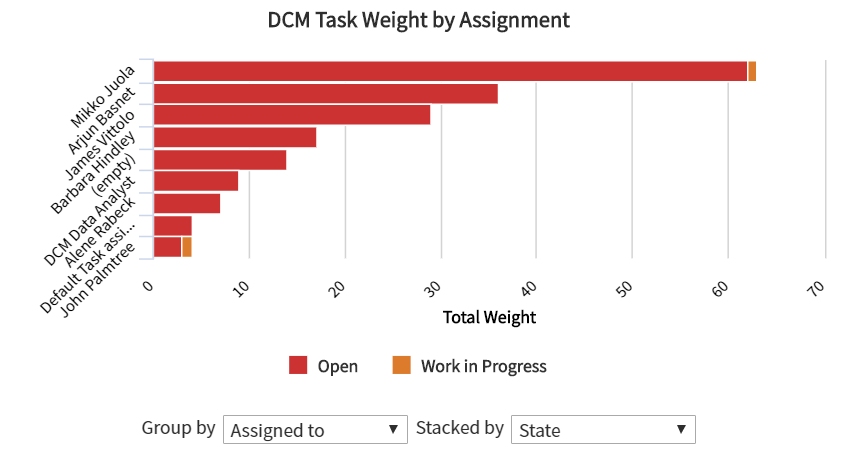 | Horizontal bar | x_jugr_dcm_task | Currently open DCM Tasks grouped by assignment and status. Default grouping is based on Assigned to, but the selection also includes the Assignment group. | IN USE | NO |
| 60 | My DCM Task Weight by Assignment DCM Tasks - My Domains - DCM Task Weight by Assignment | Horizontal bar | x_jugr_dcm_task | Same as "DCM Task Weight by Assignment", but filtered based on Data Domains related to current user. Usage: See who has the most remediation tasks open under your domain. Use this information to go through the deviations with responsible persons or simply follow up the tasks. | IN USE | Audit - My Data Domains | |
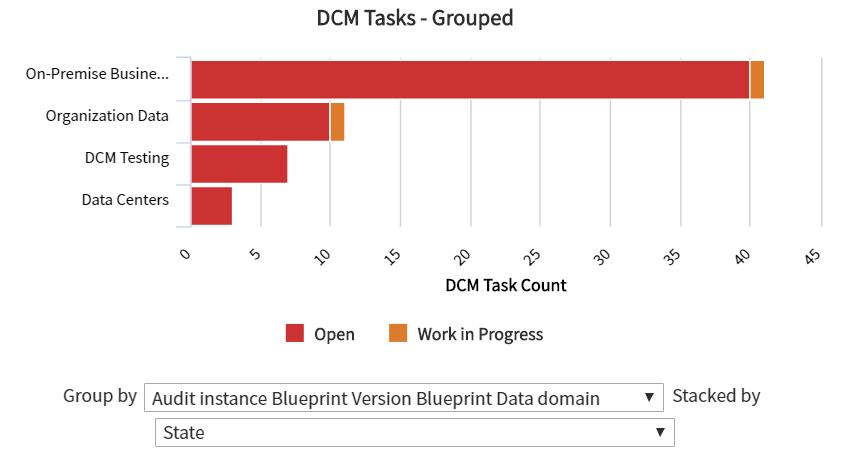
| 61 | DCM Tasks - Grouped DCM Tasks - Grouped |
| Horizontal bar | x_jugr_dcm_task | Currently open DCM Tasks grouped by Data domain and state (by default). Other grouping factors include Data tier, Category, Implementation phase, Blueprint, and State for example. | IN USE | Workspace - Overview |
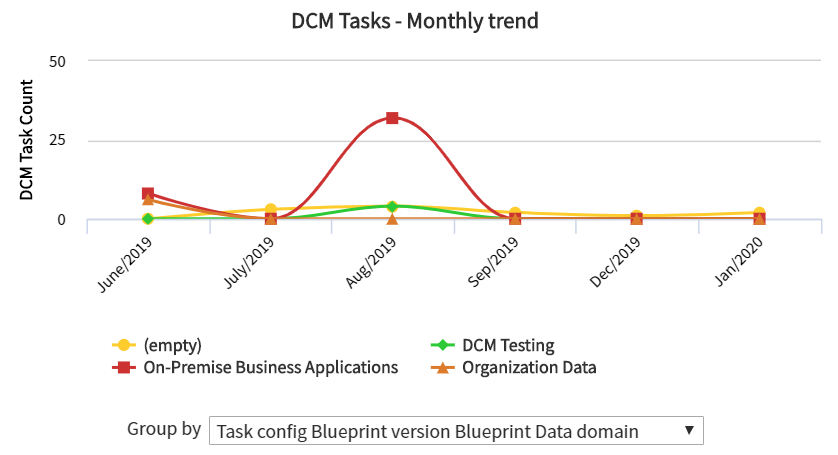
| 62 | DCM Tasks - Monthly trend DCM Tasks - Monthly trend |
| Spline | x_jugr_dcm_task | Number of new DCM tasks created as a monthly trend grouped by Data domain. Other grouping factors include Data tier, Category, Implementation phase, Blueprint, and State for example. | IN USE | NO |
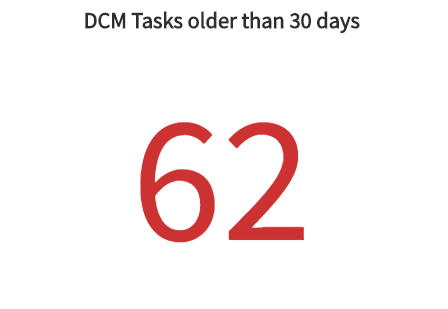
| 63 | DCM Tasks older than 30 days DCM Tasks - DCM Tasks older than 30 days |
| Single score | x_jugr_dcm_task | Number of open tasks that have been created over 30 days ago. Number will turn red, if more than 10 tasks are still open. | IN USE | NO |
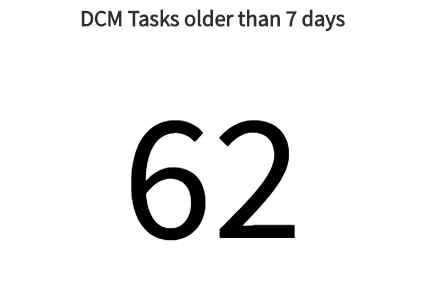
| 64 | DCM Tasks older than 7 days DCM Tasks - DCM Tasks older than 7 days |
| Single score | x_jugr_dcm_task | Number of open tasks that have been created over 7 days ago. Number will turn red, if more than 100 tasks are still open. | IN USE | Workspace - Overview |
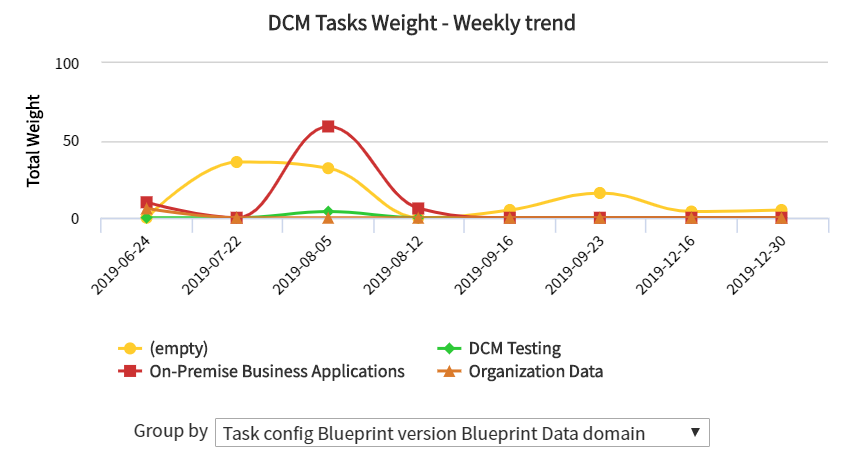
| 65 | DCM Tasks Weight Weekly trend DCM Tasks - Weight Weekly trend |
| Spline | x_jugr_dcm_task | The total weight on currently open tasks as a monthly trend based on created date and grouped by Data domain. Other grouping factors include Data tier, Category, Implementation phase, Blueprint, and State for example. | IN USE | NO |
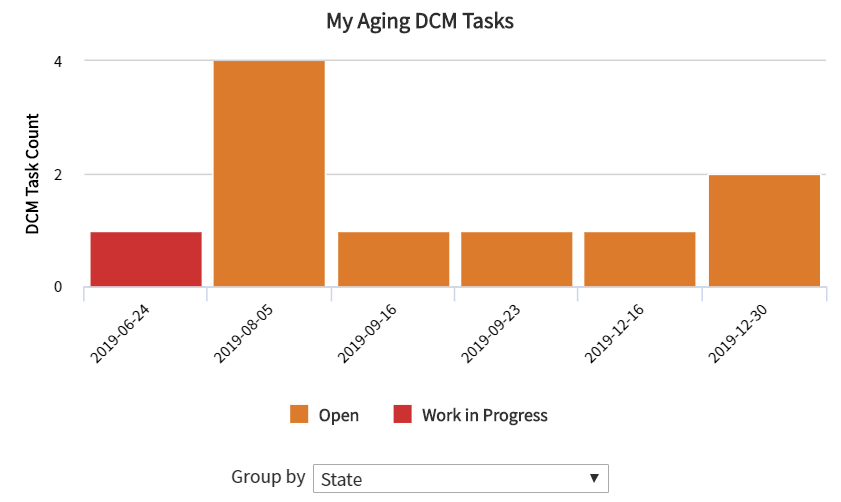
| 66 | My Aging DCM Tasks DCM Tasks - My Aging DCM Tasks |
| Trend | x_jugr_dcm_task | DCM Tasks assigned to current user grouped by their creation date. | IN USE | Workspace - My Tasks |
| 67 | My DCM Task List My DCM Task List | 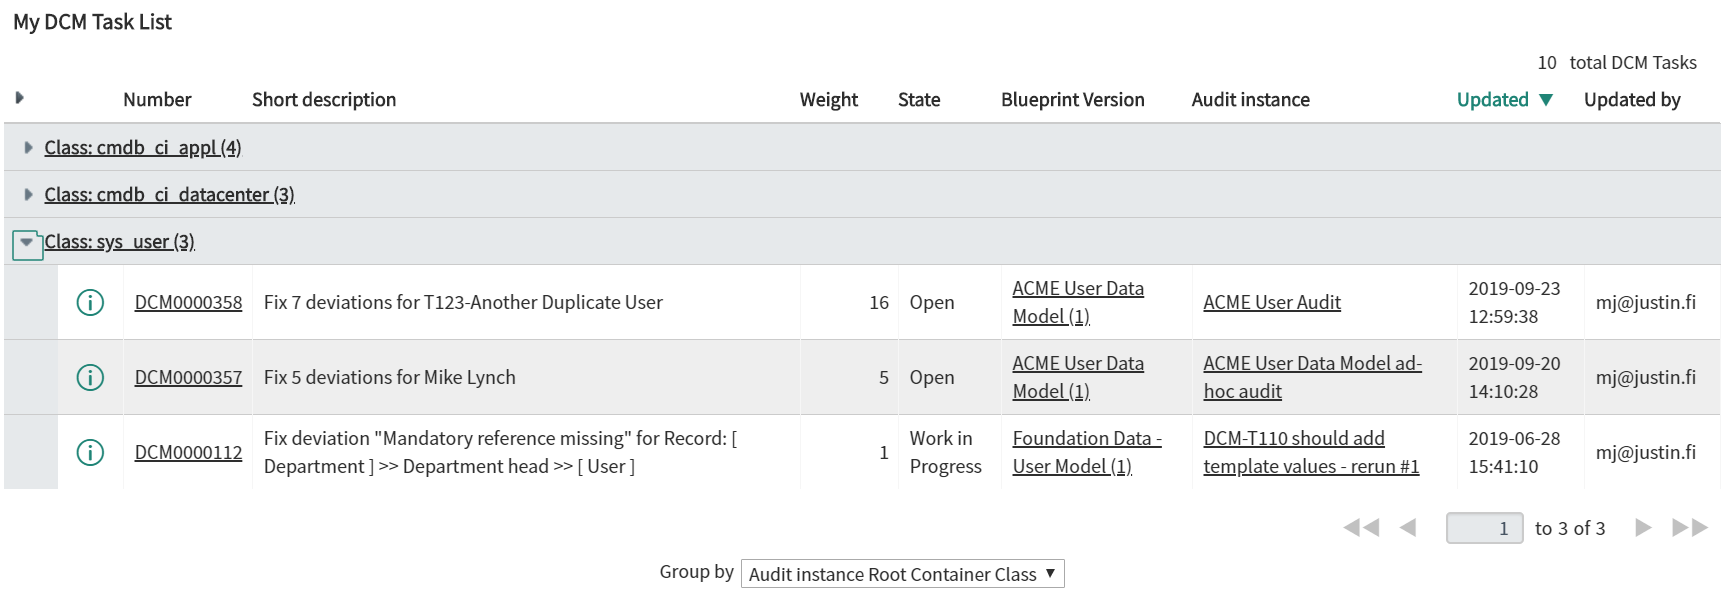 | List | x_jugr_dcm_task | Currently open DCM Tasks assigned to the current user as a list grouped by class. | IN USE | Workspace - My Tasks |
| 68 | My DCM Tasks - Grouped DCM Tasks - My DCM Tasks - Grouped |
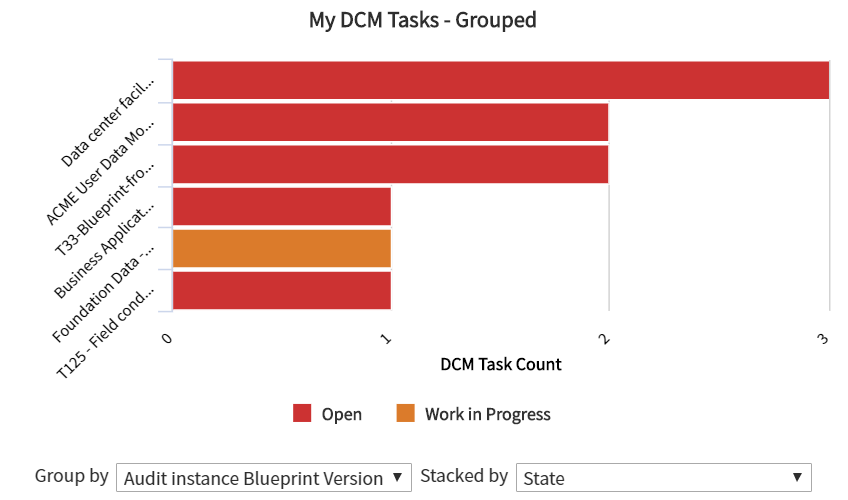
| Horizontal bar | x_jugr_dcm_task | Currently open DCM Tasks assigned to the current user grouped by Blueprint and status. Other groupings include data tier and domain, implementation phase and assignment group. | IN USE | Workspace - My Tasks |
| 69 | My Open DCM Tasks DCM Tasks - My Open DCM Tasks |
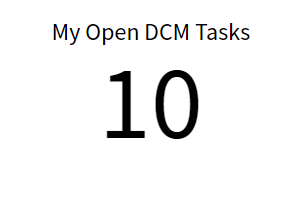
| Single score | x_jugr_dcm_task | Number of currently open DCM Tasks assigned to the current user. | IN USE | Workspace - My Tasks |
| 70 | My Task Configurations DCM Tasks - My Task Configurations |
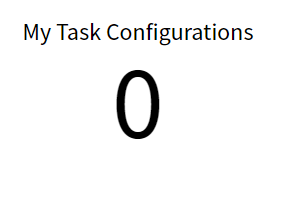
| Single score | x_jugr_dcm_task | Number of DCM Task configurations managed by the current user. | IN USE | Workspace - My Tasks |
| 71 | Open DCM Tasks DCM Tasks - Open DCM Tasks |
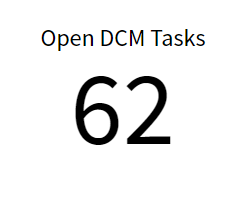
| Single score | x_jugr_dcm_task | Total number of currently open DCM tasks. | IN USE | Workspace - Overview |
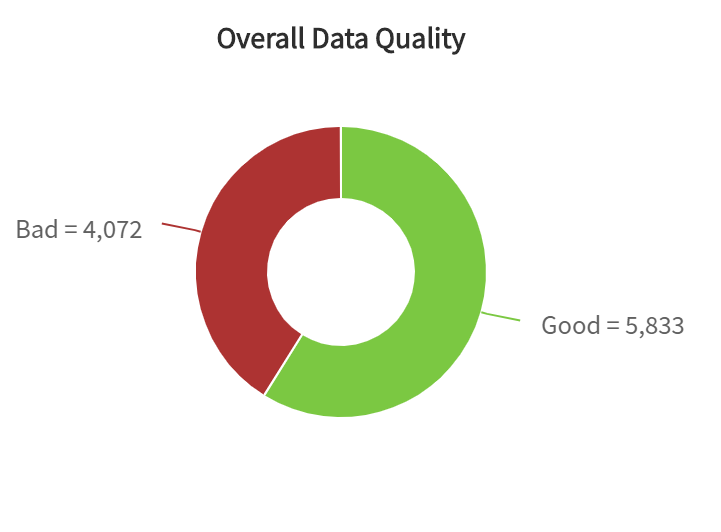
| 72 | Overall Data Quality DCM - Overall Data Quality - Good vs. Bad Data |
| Donut | x_jugr_dcm_... unique_audit_message | Unique audit messages divided into good and bad data. Good = all compliant and note level deviations. Bad = all other deviations. | IN USE | NO |
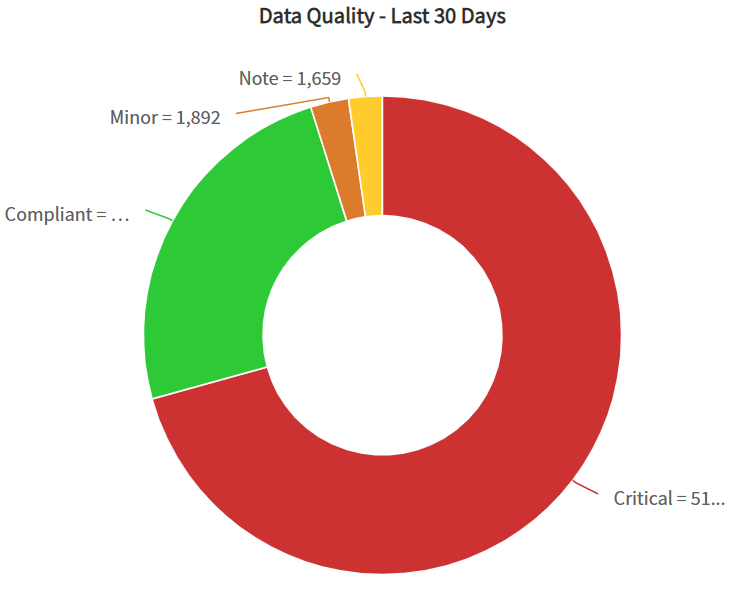
| 73 | Data Quality - Last 30 Days DCM - Overall Data Quality - Last 30 Days |
| Donut | x_jugr_dcm_... unique_audit_message | Unique audit messages grouped by UAM status for the last 30 days. Usage: Gives a quick overview on the overall data quality. | IN USE Updated in 5.1.1 | Audit - Data Quality - Monthly Overview |
| 74 | Data Quality - Last 7 Days DCM - Overall Data Quality - Last 7 Days | Donut | x_jugr_dcm_... unique_audit_message | Unique audit messages grouped by UAM Status for the last 7 days. Usage: Gives a quick overview on the overall data quality. | NEW Updated in 5.1.1 | Audit - Data Quality - Weekly Overview | |
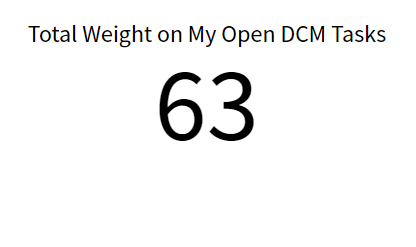
| 75 | Total Weight on My Open DCM Tasks DCM Tasks - Total Weight on My Open DCM Tasks |
| Single score | x_jugr_dcm_task | Total weight on open DCM Tasks assigned to the current user. | IN USE | Workspace - My Tasks |
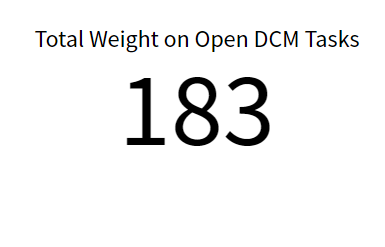
| 76 | Total Weight on Open DCM Tasks DCM Tasks - Total Weight on Open DCM Tasks |
| Single score | x_jugr_dcm_task | Total weight on all open DCM Tasks. | IN USE | Workspace - Overview |
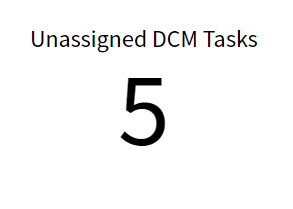
| 77 | Unassigned DCM Tasks DCM Tasks - Unassigned DCM Tasks |
| Single score | x_jugr_dcm_task | Number of open DCM Tasks that are not assigned to an individual. | IN USE | NO |
| 78 | DCM - My Domains DCM - My Domains |
| List | x_jugr_dcm_... data_domain | List of DCM Data Domains where current user is either an Owner, Manager, Group member or a listed Stakeholder. | IN USE | Audit - My Data Domains |
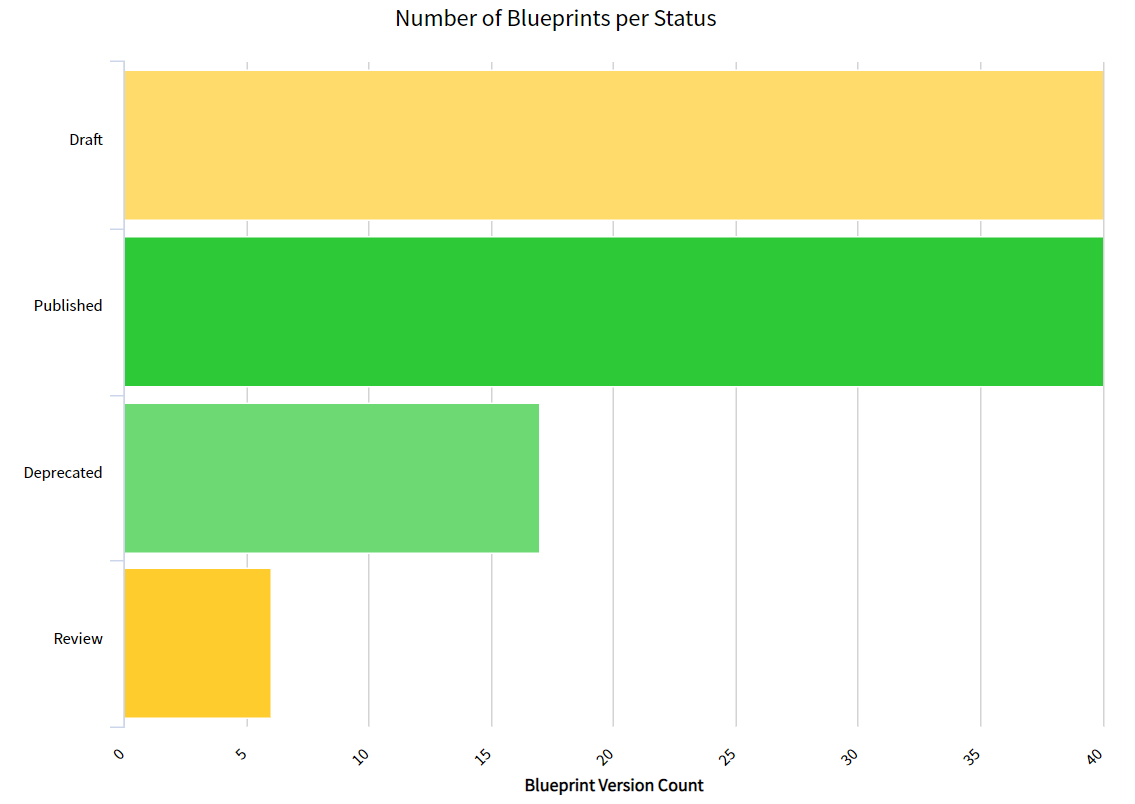
| 79 | Number of Blueprints per Status DCM - Current number of Blueprints per Status |
| Horizontal bar | x_jugr_dcm_... bp_blueprint_version | Current blueprint versions grouped by Status. Usage: Blueprint optimization. Identify for example deprecated or retired blueprints. | IN USE | NO |
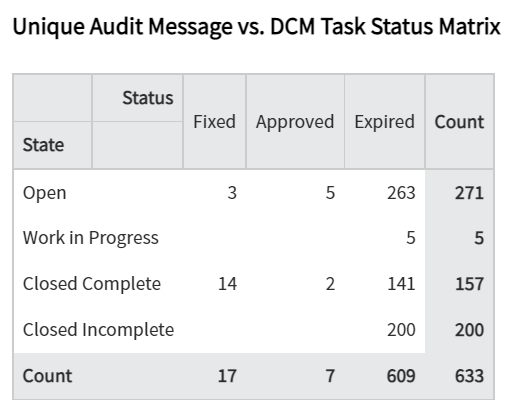
| 80 | Unique Audit Message vs. DCM Task Status Matrix DCM Tasks - Unique Audit Message vs. Task Status Matrix |
| Multi-Level Pivot | x_jugr_dcm_... unique_audit_message | Pivot table showing number of Unique Audit Message with particular UAM and Task status. Usage: Identify illogical status combinations. For example "Fixed" + "Open" could mean that all issues have been fixed already, but task is still open. Or "Expired" + "Open" could mean the same thing or that audited issues are no longer relevant and tasks should be closed. | NEW Introduced in 5.2 | NO |
| 81 | Audit Schedules without Blueprint DCM - Audit - Scheduled audits without Blueprint version |
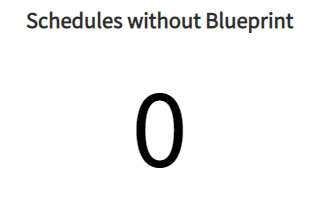
| Single score | x_jugr_dcm_... audit_schedule | Control report to show if any active Audit Schedules have lost their Blueprint version. This can happen, when old blueprint versions are being deleted and it usually prevents audits from running. Usage: This report should always show "Zero". If not, please check and update Audit Schedules identified by this report. Either reactivate the schedule or select another blueprint version to be used within the audit. | NEW Introduced in 5.2 | Blueprints - Overview |
Deprecated reports
The following table includes all "deprecated" reports that used to be part of the DCM application, but are no longer in use.
Report Title (Name, if <> Title) | Thumbnail | Type | Source table | Description | Status | on Dashboard | |
|---|---|---|---|---|---|---|---|
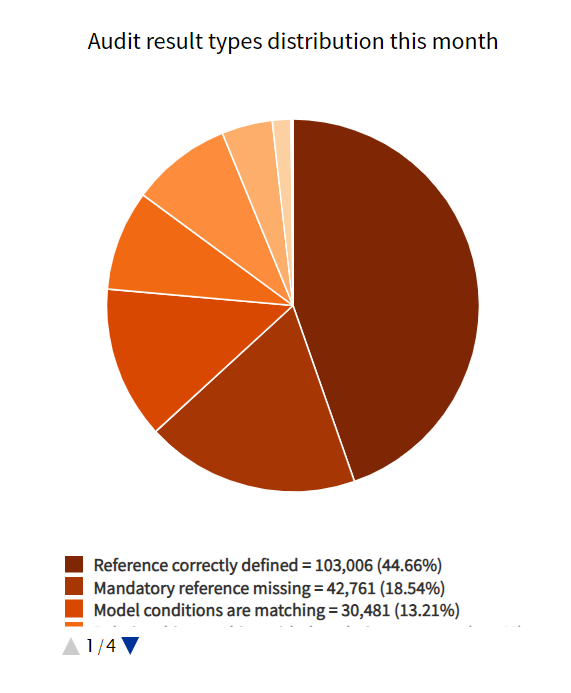
| 1 | (Deprecated) Audit result types distribution this month DCM (Deprecated) - Audit result types distribution this month |
| Pie | Audit messages from the current month grouped by Audit result type. | DEPRECATED Deprecated in R4.5 | NO | |
| 2 | (Deprecated) Audited records - last month DCM (Deprecated)- Audit results per deviation level - last month |
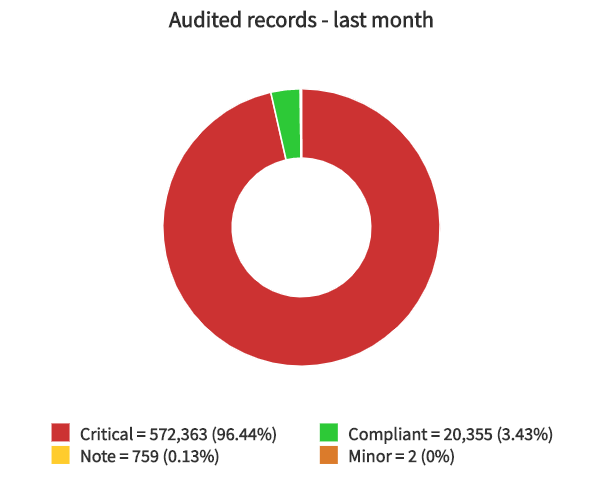
| Donut | Audit results (audited records) per deviation level for the previous month. | DEPRECATED Deprecated in R4.5 | NO | |
| 3 | (Deprecated) Audited records - this month DCM (Deprecated) - Audit results per deviation level - this month |
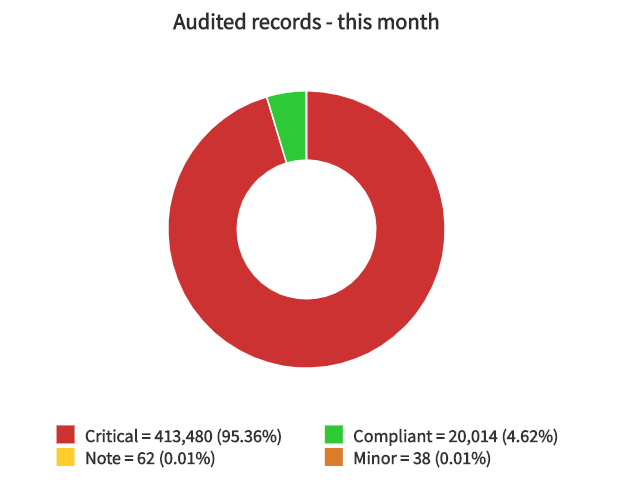
| Donut | Audit results (audited records) per deviation level for the current month. | DEPRECATED Deprecated in R4.5 | NO | |
| 4 | (Deprecated) Audit Messages for an Audit instance DCM (Deprecated) - Audit Messages for an Audit instance |
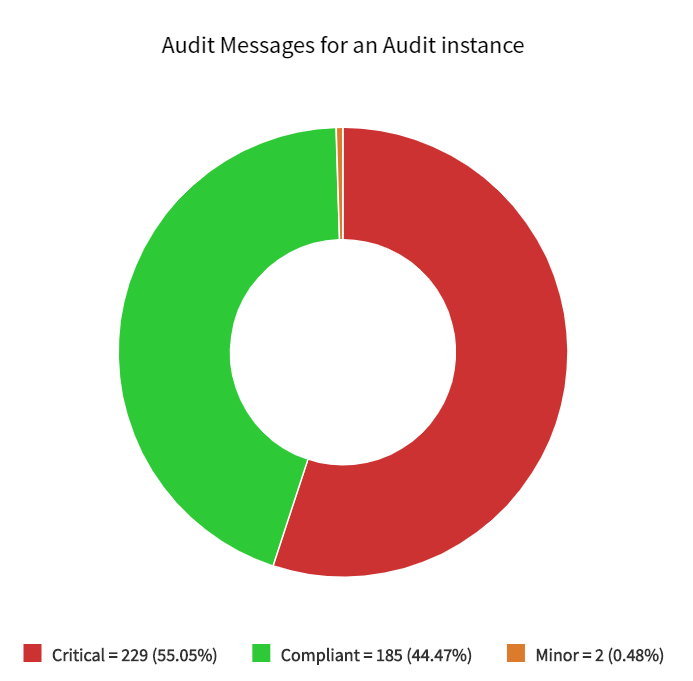
| Donut | Audit messages for a single audit instance grouped by deviation type. This report is meant as a template and using the report requires that report is being edited when an audit instance is selected. Idea is to show results for a single audit based on audit messages instead of audited record compliance that is shown on the Audit results page (as Overview). | DEPRECATED Deprecated in R4.5 | NO | |
| 5 | (Deprecated) UAMs for an Audit instance DCM (Deprecated) - Unique Audit Messages for an Audit instance |
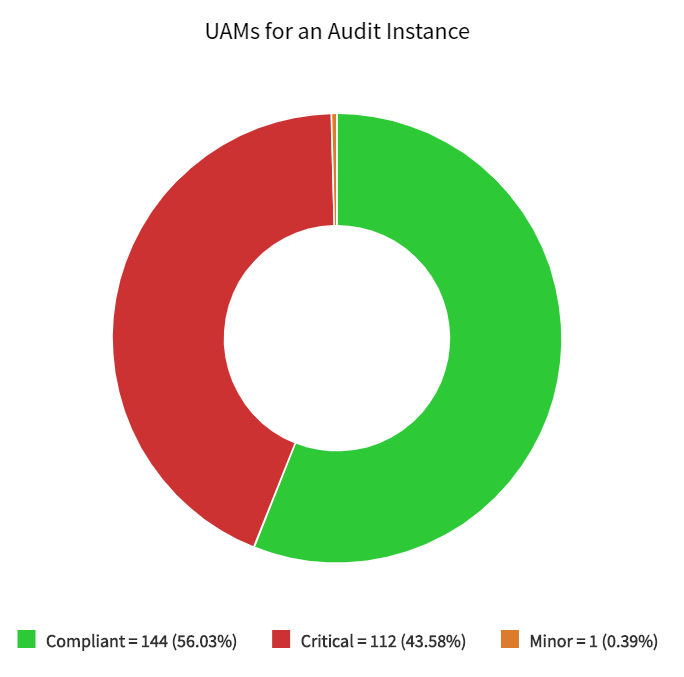
| Donut | An alternative to the "Audit Messages for an Audit Instance" report. This one is only showing the unique audit messages instead of all of them. This report is meant as a template and using the report requires that report is being edited when an audit instance is selected. | DEPRECATED Deprecated in R4.5 | NO | |
| 6 | DCM DELETED - Blueprint compliance bubble chart last month | Bubble | Please delete this report from your instance. | DELETED | NO | ||
| 7 | DCM DELETED - Blueprint compliance bubble chart this month | Bubble | Please delete this report from your instance. | DELETED | NO | ||
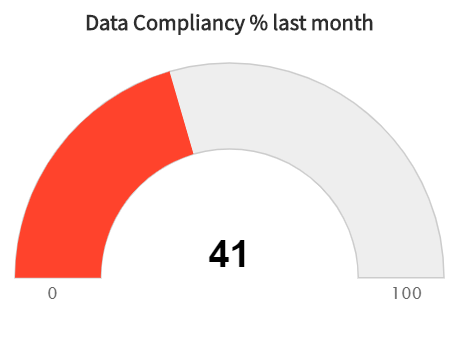
| 8 | (Deprecated) Data Compliance % last month DCM (Deprecated) - Blueprint compliance average last month |
| Dial | Overall data quality index for the current month. This number is showing the average compliant messages percentage from all audits run within the last month. | DEPRECATED Deprecated in R4.5 | NO | |
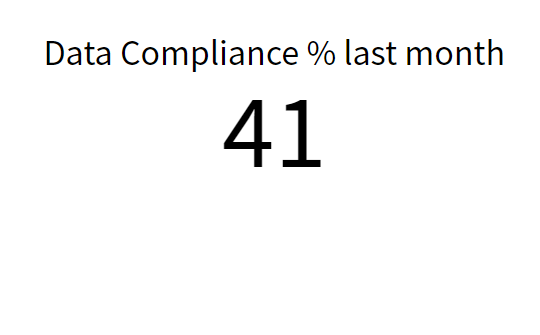
| 9 | (Deprecated) Data Compliance % last month DCM (Deprecated) - Blueprint compliance average last month |
| Single score | Overall data quality index for the current month. This number is showing the average compliant messages percentage from all audits run within the last month. Alternative version to dial type of report. | DEPRECATED Deprecated in R4.5 | NO | |
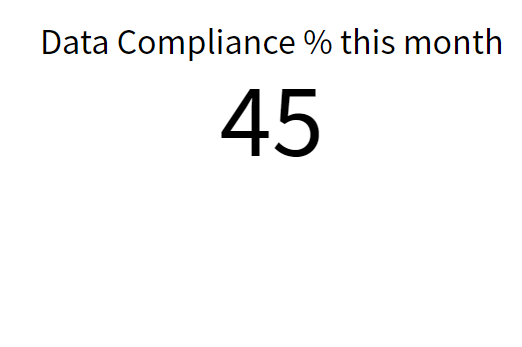
| 10 | (Deprecated) Data Compliance % this month DCM (Deprecated) - Blueprint compliance average this month |
| Single score | Overall data quality index for the current month. This number is showing the average compliant messages percentage from all audits run within the last month. Alternative version to dial type of report. | DEPRECATED Deprecated in R4.5 | NO | |
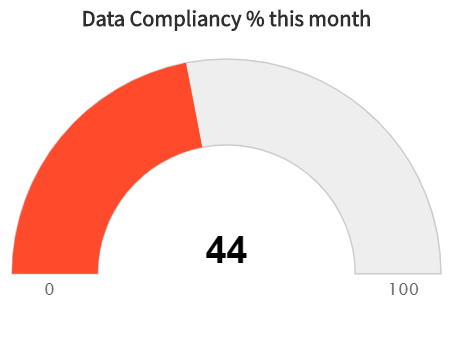
| 11 | (Deprecated) Data Compliance % this month DCM (Deprecated) - Blueprint compliance average this month |
| Dial | Overall data quality index for the current month. This number is showing the average compliant messages percentage from all audits run within the current month. | DEPRECATED Deprecated in R4.5 | NO | |
| 12 | (Deprecated) Compliance per audited records % average monthly trend DCM (Deprecated) - Blueprint compliance per audited records % average monthly trend |
| Spline | Data compliance trend based on audited records as a monthly trend. Average means that if the same audit has been run multiple times during the month, then an average result is shown. Default grouping per Data Tier. The graph will show positive numbers only for those audited records that are fully compliant with the blueprint. That is why this is a more demanding report than the one using Audit messages compliance. | DEPRECATED Deprecated in R5.1.1 | NO | |
| 13 | (Deprecated) Compliance per audited records % average weekly trend DCM (Deprecated) - Blueprint compliance per audited records % average weekly trend |
| Spline | Data compliance trend based on audited records as a weekly trend. Average means that if the same audit has been run multiple times during the week, then an average result is shown. Default grouping per Data Tier. The graph will show positive numbers only for those audited records that are fully compliant with the blueprint. That is why this is a more demanding report than the one using Audit messages compliance. | DEPRECATED Deprecated in R5.1.1 | NO | |
| 14 | (Deprecated) Completed audits last month DCM (Deprecated) - Completed audits last month | 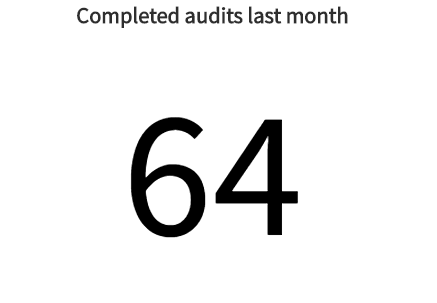 | Single score | Number of completed audits from the previous month. | DEPRECATED Deprecated in R4.5 | NO | |
| 15 | (Deprecated) Completed audits this month DCM (Deprecated) - Completed audits this month | 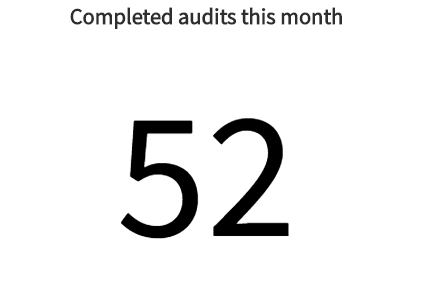 | Single score | Number of completed audits for the current month. | DEPRECATED Deprecated in R4.5 | NO | |
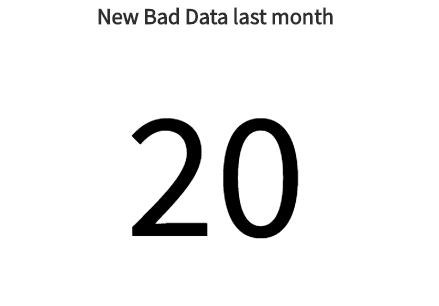
| 16 | (Deprecated) New Bad Data last month DCM (Deprecated) - New Bad Data Discovered by Audit last month |
| Single score | x_jugr_dcm_... unique_audit_message | Total weight on unique audit messages created during the previous month. | DEPRECATED Deprecated in R4.5 | NO |
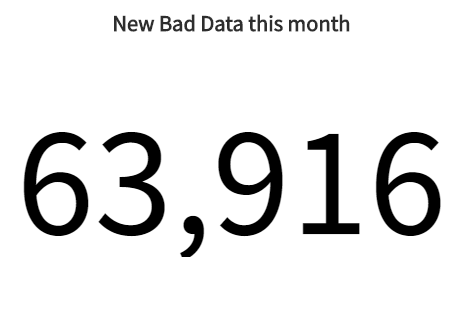
| 17 | (Deprecated) New Bad Data this month DCM (Deprecated) - New Bad Data Discovered by Audit this month |
| Single score | x_jugr_dcm_... unique_audit_message | Total weight on unique audit messages created during the current month. | DEPRECATED Deprecated in R4.5 | NO |
| 18 | (Deprecated) Non-Compliant Audit Messages by Result Type DCM (Deprecated) - Non-Compliant Audit Message Distribution |
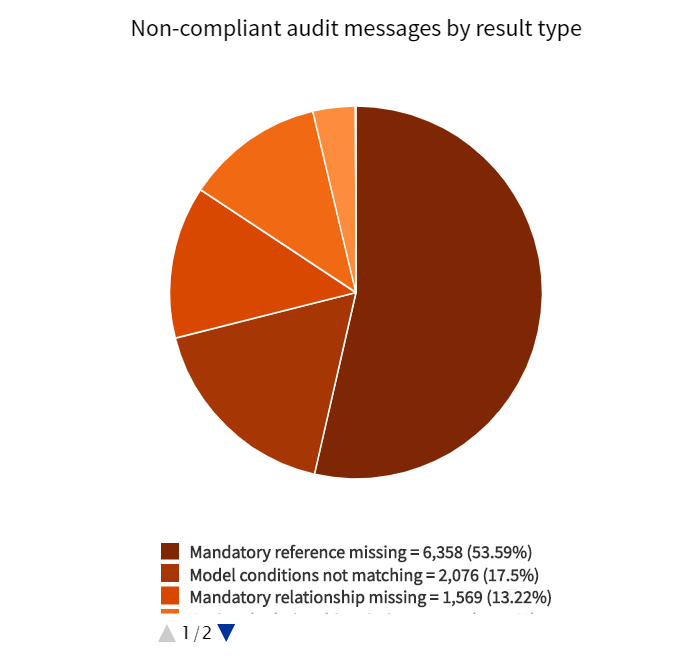
| Pie | x_jugr_dcm_... audit_message | Non-compliant audit messages from the last three months grouped by audit result type. Please note that old audit messages are deleted when the same audit is run again and a matching audit message is found and connected to same unique audit message. This report is no longer used on default dashboards due to the introduction of unique audit messages and related reports. | DEPRECATED Deprecated in R4.5 | NO |
| 19 | (Deprecated) Non-compliant audit messages per class last month DCM (Deprecated) - Non-compliant audit messages per class last month |
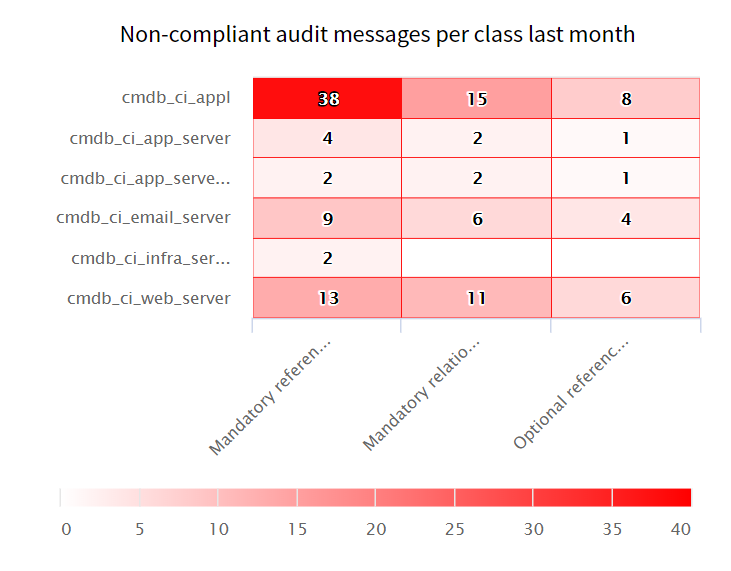
| Heatmap | x_jugr_dcm_... audit_message | The number of non-compliant audit messages per class and audit result type created within the previous month. This report is no longer used on default dashboards due to the introduction of unique audit messages and related reports. | DEPRECATED Deprecated in R4.5 | NO |
| 20 | (Deprecated) Non-compliant audit messages per class this month DCM (Deprecated) - Non-compliant audit messages per class this month |
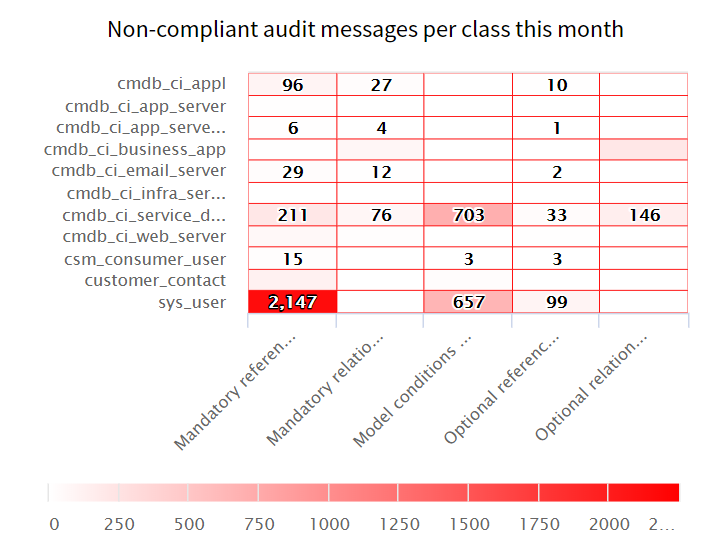
| Heatmap | x_jugr_dcm_... audit_message | The number of non-compliant audit messages per class and audit result type created during the current month. This report is no longer used on default dashboards due to the introduction of unique audit messages and related reports. | DEPRECATED Deprecated in R4.5 | NO |
| 21 | (Deprecated) Non-Compliant UAM Distribution DCM (Deprecated) - Non-Compliant Unique Audit Message Distribution |
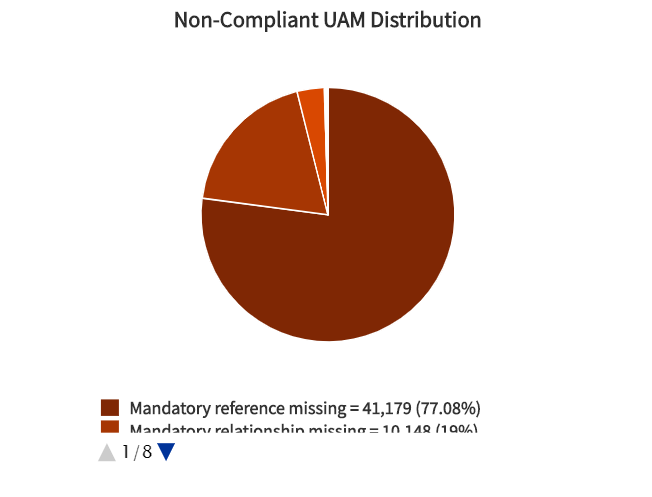
| Pie | x_jugr_dcm_... unique_audit_message | Non-compliant unique audit messages from the last 3 months grouped by the audit result type. | DEPRECATED Deprecated in R4.5 | NO |
| 22 | (Deprecated) Today's Audit deviations per Manager DCM (Deprecated) - Today's Audit deviations per Manager |
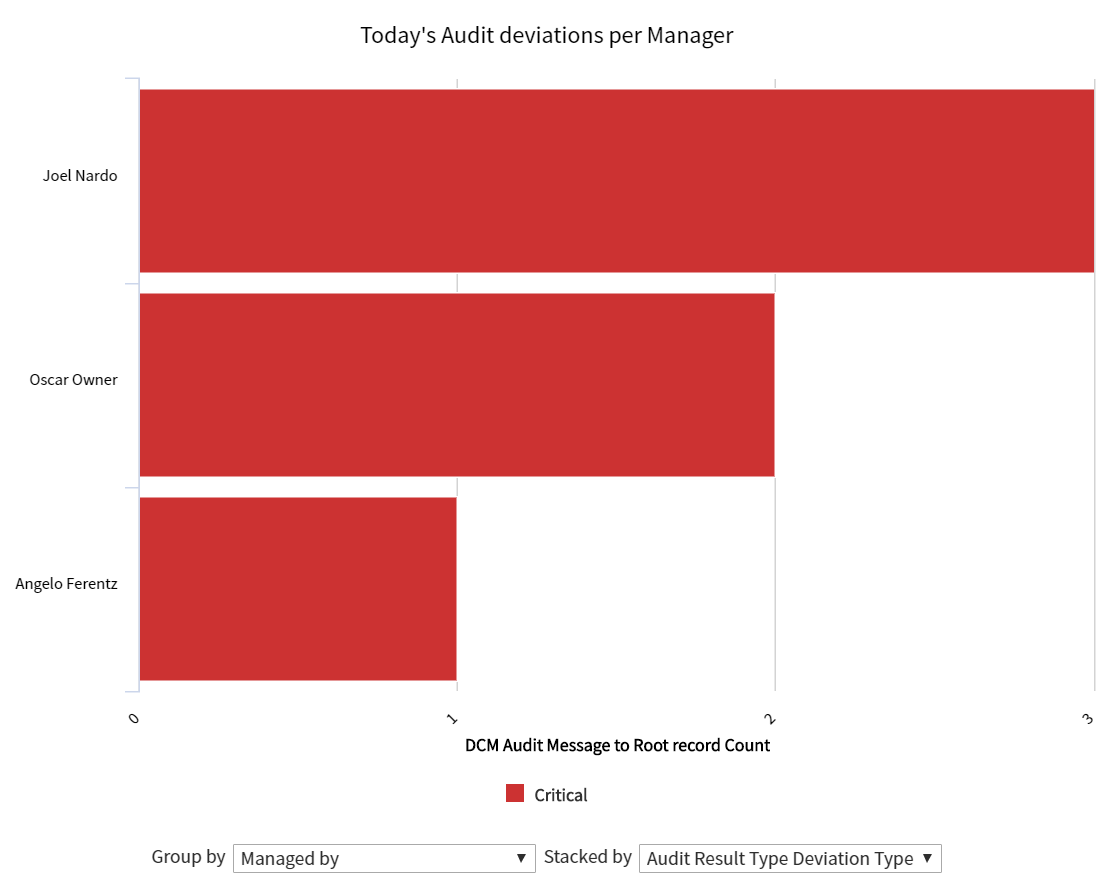
| Horizontal bar | x_jugr_dcm_... unique_audit_message | Non-compliant audit messages from today grouped by the Managed by field on the Real record related to the audit message. This is an example report that uses a database view that connects audit messages into configuration items. This DB view allows using CI attributes as grouping factors. | DEPRECATED Deprecated in R4.5 | NO |
| 23 | (Deprecated) Unique Audit Messages - Grouped DCM - Unique Audit Messages - Grouped |
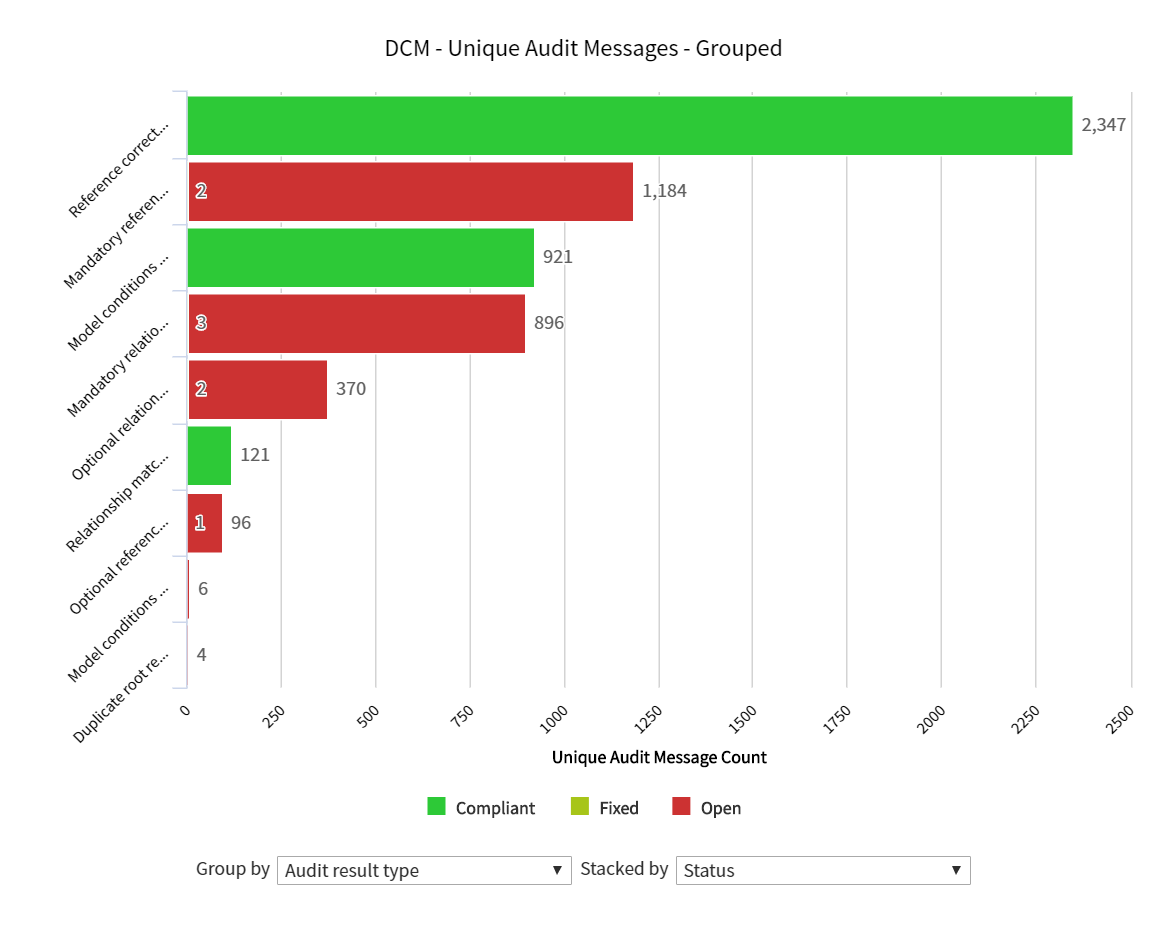
| Horizontal bar | All unique audit messages from the last 6 months grouped by Audit result type (by default). Other groupings include for example deviation type, blueprint element, class, status and real record. | DEPRECATED Deprecated in R4.5 | NO | |
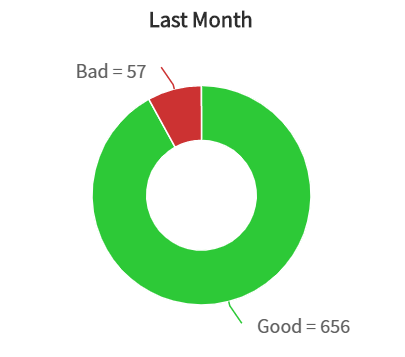
| 24 | (Deprecated) Last Month DCM (Deprecated) - Last Month Audit Data Quality - Good vs. Bad Data |
| Donut | x_jugr_dcm_... unique_audit_message | Unique audit messages created during the previous month divided into good and bad data. Good = all compliant and note level deviations. Bad = all other deviations. | DEPRECATED Deprecated in R5.1.1 | NO |
| 25 | Top 5 DCM Task | List | DELETE | ||||
| 26 | Top 5 UAMs185px | List | DELETE |
© Qualdatrix Ltd 2021 | All rights reserved.